
Author: Sara George | December 2014
Abstract
International pollution issues aren’t always anthropogenically caused; the earth in its natural, untouched state also contributes to global pollution. Volcanic activity, is an example of a non-anthropogenic source of international pollutions. Volcanic eruptions release large quantities of greenhouse gases and other aerosols into the atmosphere, these gases form massive clouds which accumulate in the atmosphere; this process is referred to as outgassing or offgassing In addition to magma particulates, known as ash or pyroclastic flow, volcanic eruptions release water vapor(H₂0), carbon dioxide(CO₂), sulphur dioxide(SO₂), hydrogen sulfide(H₂S), carbon monoxide(CO), hydrogen chloride(HCl), and hydrogen fluoride(HF) into the atmosphere. This combination of outgassed particulates as the ability to inflict vast detrimental impacts on the rest of the globe. Earth’s biosphere can be depreciated as a result of volcanic pollution; animals and plant life, during an outgassing event, are susceptible to toxic and harmful volcanic pollutants. Gases derived from volcanoes have severe detrimental impacts on vegetation; direct exposure to volcanic gases over a long term period is lethal to most plant life (McGee, 1997). The respiratory system, in particular, of humans and other species of animals in kind can be extremely damaged when exposed to sulphur dioxide(SO₂) and hydrogen fluoride(HF). In addition, the introduction of sulphur dioxide to water vapor in the atmosphere causes acid rain on a global scale. Through atmospheric circulation, these outgassed clouds become dispersed and diffuse significantly. In 1883 the eruption of Krakatau in Indonesia outgassed aerosol particulates that dispersed all the way to New York; 13 days after this volcanic eruption, New Haven, NY experienced conflagrations. The volcanic dust cloud which was formed by Krakatau’s eruption also acted as a solar radiation barrier, surface temperature decreased and took about 5 years to return to normal. Volcanically sourced pollution also has the potential to release as much carbon dioxide(CO₂) and sulphur dioxide(SO₂) during a single eruption than 250 years of anthropogenically produced pollution. This paper will look at the non-anthropogenic release of volcanic pollutants both on a local and international level; there will also be an emphasis on sulphur dioxide and its introduction and interaction with the earth’s atmosphere.
Key words: volcanic pollution, volcanism, non-anthropogenic pollution, sulphur dioxide, international pollution, volcano, outgassed pollutants
Background
A volcanic eruption is caused by the ascent of molten rock from the mantle through the asnethophere up to Earth’s crust. Figure 1 is a diagram of a volcanic eruption event; it illustrates all the processes and byproducts that occur during an eruption event (USGS, 2010).
|
Partially melted mantle rock is introduced to Earth’s surface commonly along tectonic plate boundaries. Silica rich volcanic eruptions can be seen occurring at subduction zones; the Ring of Fire is a large cluster of volcanoes that rest above these subduction zones. Basaltic eruptions occur at divergent boundaries where plates move away from each other, the Icelandic volcano Eyjafjallajokull located on the Mid-Atlantic Ridge is a basaltic volcano (Sammonds, 2010). The forming volcano is supplied by magma from a chamber and is pushed through the crust by ways of a conduit. Through the combination of high pressure and elevated rates of geothermal energy magma is forced up through the conduit. The rate at which the magma ascends through the conduit onto Earth’s crust depend on the amount of silica and oxygen within the magma. Supervolcanoes, for instance, have extremely high levels of silica and oxygen; both these elements allow for large outgassing events where aerosols and gases ascend into the stratosphere (USGS, 2010). Both the eruptions of Mt. Pinatubo’s in 1991 and Krakatau of 1883 where categorized as supervolcanoes, silica and oxygen rich magma created an calamitous outgassing event for both volcanic eruptions (USGS, 2010). Magma is composed of a mix of silicon, oxygen, aluminum, alkalis(sodium, potassium, calcium), magnesium, and iron (IVHHN). Magma is released up onto earth’s surface through fissure vents located around the mouth of the conduit. Magma is expelled either in the form of lava or in the form of ash. Lava is the semi fluid non-explosive effusive rock that spills over onto the Earth’s surface; lava can range from temperature anywhere between 700ᵒC-1,200ᵒC (Krauskopf, 1947). The elevated temperature characteristic of lava makes it 100,000 times as viscous as water; it is also capable of having flow rate of up to 60 meters per minute. When cooled, lava forms tube like structures that run down the sides of the volcano (Krauskopf, 1947). Every eruption episode that occurs throughout the volcanoes life span adds a new layer of igneous rock, building up the volcanoes cone.
|
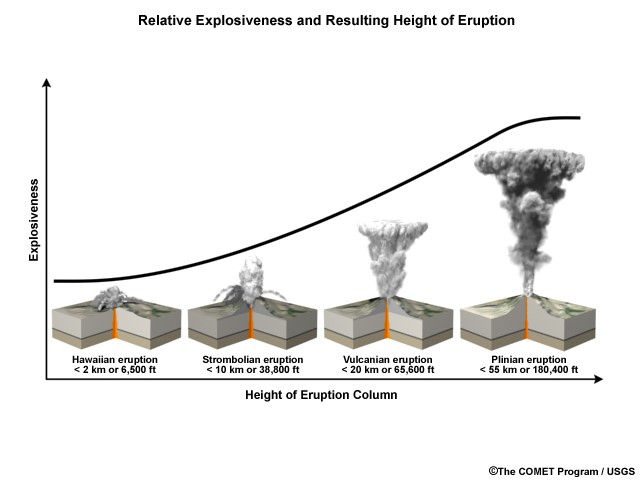
Along with lava, ash clouds are ejected in the form of volcanic column plumes. Pyroclastic flow is hot gas and rock tephra that is expelled at high speeds and at high temperature during volcanism. Ash and other volatiles from pyroclastic flow can extend up to 50 km into the atmosphere at a speed of 700 km/h (Bryant, 2005). This fast moving cloud can reach up to temperatures of around 1,000ᵒC. Water, within the magma, provides the explosive potential of an eruption. Figure 2 illustrates the explosive potential of eruptions; as explosive potential increases so does the concentration of silica, oxygen, and of course water. Outgassed ash clouds extend up into the upper troposphere and into the lower stratosphere, also known as the UTLS; the height at which the volcanic plume reaches depends on the pressure within the volcanoes conduit tube and, as mentioned previously, depends on the amount of silica and oxygen within the magma (Krotkov, 2010). The extent at which the volcanic ash cloud extends at the time of eruption depends on particulate size, wind speed and direction, and eruption type. With the increase in particulate size there is a decrease in the distance of which the ash cloud disperses; smaller particulates allow for the ash cloud to extend further up and around the earth’s atmosphere. Wind speed affects how far and at what rate the ash cloud extends while wind direction influences where the ash cloud is guided. Eruption type, as seen in Figure 2, is the initial governing factor of what drives the establishment and the movement of the ash cloud (Lamb, 2008). Hawaiian, Strombolian, Vulcanian, Plilian, Lava Dome (Pelean eruption), and Surtseyan (Icelandic eruption) are eruption types (Schmincke, 2004).
A Hawaiian eruption is characterized by it’s fluid basaltic lava that is expelled into the air from jets derived from fissure vents. In this eruption type due to the expulsion of lava through jets, the duration of eruption time is extensive; jets offer a steady continual lava flow allowing for drawn out eruption time. A Hawaiian volcano eruption time can last from anywhere from 1 hour to a couple day. The Kilauea volcano in Hawaii is characterized as having a Hawaiian eruption type. Strombolian eruption is another eruption type; characterized as having a bursting like expulsion of lava, a strombolian eruption is usually basaltic or basaltic andesite in origin. Unlike the Hawaiian eruption time that has a constant releases of lava, the Strombolian expels lava at minute intervals. This eruption time also can reach up to hundreds of meters and eject lava and pyroclastic flow onto earth’s surface by spatters. Vulcanian eruption occurs when violent, short, and, minimal amounts of lava is released during a single eruption event; ash clouds also are highly explosive reaching up to 350 meters per minute. A lava dome and an umbrella like ash cloud is produced. The most extensive and violent eruption type is the Plinian; ash columns have the ability to reach up to 50 km and speeds of about 100 meters per second. Ash clouds can disperse out to a distance of around 100 to 1,000 miles. A Plinian eruption has a ash column similar to a mushroom. These eruptions are tremendously destructive, ash particulates and lava bombs extend miles away from the volcano; the 1980 eruption of Mount St. Helens is a Plinian eruption. Icelandic eruption also known as the surtseyan eruption originates underwater; this eruption time is characterized as being hydromagmatic where magma or lava becomes explosive when it comes in contact with water. The Surtsey volcano is one example of an Icelandic eruption type volcano. (Ball, 2005)
Volcanic Pollutants
A volcanic eruption is both an international pollutant source and an international hazard. The United States Geological Survey states that “Volcanoes produce a wide variety of hazards that can kill people and destroy property. Large explosive eruptions can endanger people and property hundreds of miles away and even affect global climate”. During a volcanic eruption a mixture of gases and particulates are expelled. The discharge of gases can also occur between major eruption events; volatile gases such as hydrogen fluorine(HF) and carbon monoxide(CO) trickle out of cracks and fissure along the surface of the volcano (SDSU, 2000). Cracks, known as fumaroles, along the surface of the volcano allow for the seepage of gases above earth’s surface. Water vapor is one of the major components in the outgassed material from an eruption; water vapor accounts for about 80% of the gases emitted which is released as steam. 79% of water, 11.6% carbon dioxide, 6.5% sulphur dioxide, and 2.9% of lesser constituents are the average concentration of volcanic gas clouds (Horton and McCaldin, 1964). Volcanoes, as mentioned previously, have varying eruption types; this divergence in eruption type allows for each volcano to be unique and allows for different eruption compositions and concentrations. Each volcanic eruption, even from the same volcano, has different concentration of outgassed aerosols and other pollutants. The average breakdown of gas pollutants that can be found during an eruption is as follows: carbon dioxide(CO₂), sulphur dioxide(SO₂), hydrogen sulfide(H₂S), hydrogen(H₂), hydrogen fluoride(HF), hydrogen chloride(HCl), bromide oxide(BrO) and carbon monoxide(CO). Figure 3 is a chart from the United States Geological Survey that lists the concentration of volcanic gases expelled from certain volcanic outgassing events. Figure 4 displays the release of common volcanic pollutants and how they act once introduced above earth’s surface.
Figure 3 – Volcanic gas composition (USGS, 2010)
| Volcano Tectonic Style Temperature |
Kilauea Summit Hot Spot 1170°C |
Erta` Ale Divergent Plate 1130°C |
Momotombo Convergent Plate 820°C |
| H20 | 37.1 | 77.2 | 97.1 |
| C02 | 48.9 | 11.3 | 1.44 |
| S02 | 11.8 | 8.34 | 0.50 |
| H2 | 0.49 | 1.39 | 0.70 |
| CO | 1.51 | 0.44 | 0.01 |
| H2S | 0.04 | 0.68 | 0.23 |
| HCl | 0.08 | 0.42 | 2.89 |
Sulphur dioxide also has a rapid dispersal rate due to its reaction with water vapor. When introduced into the atmosphere, sulphur dioxide undergoes a chemical reaction with other atmospheric aerosols. When sulphur dioxide comes into contact with water droplet, it oxidizes and produces sulphuric acid(H₂SO₄). Sulphur dioxide also reacts with cloud droplets or with other pre-existing aerosols; sulphur dioxide reacts with hydrogen peroxide(H₂O2) or ozone(O₃) and forms sulphate(SO₄) (Stevenson et. al., 2003). These sulphates are both harmful to human health and contribute significantly to international atmospheric pollution. SO₂ is highly soluble in water and when dispersed into the atmosphere it combines with atmospheric water vapor and forms sulphuric acid at a rapid rate.
Sulphuric acid takes on a hygroscopic characteristic which gives the sulphuric aerosols a residence time of months to even years; the residence time of sulphur dioxide depends fully on the height of the outgassed ash column , weather patterns, and total mass of particulates (Krotkov et. al., 2010). Sulphur dioxide particulates can travel for long distances according to wind direction and meteorological conditions. The spread and diffusion of sulphur dioxide and other gases and aerosols depends on three major components; (1) the actual quantity of sulphur dioxide gas released into the atmosphere (2) where in the atmosphere is the volcanic gas plume reaching, is gas being released into the troposphere or onto the stratosphere, and (3) what wind and weather patterns dominate the region (USGS, 2010). It is possible for a single eruption to have an initial plume column reach up to 55 kilometers in height; The eruption of Kasatochi in 2008 saw one of the largest discharge of sulphur dioxide since the eruption of Cerro Hudson in 1991; the outgassing of Kasatochi in 2008 released a maximum of 0.5 – 2.7 Tg of sulphur dioxide into the lower stratosphere (Krotkov et. al., 2010). Sulphur dioxide scatters and absorbs solar and terrestrial radiation; this process results in the direct radioactive forcing of climate (Krotkov et. al., 2010). Sulphur dioxide, like other aerosols, increases the reflectivity of radiation from the sun which cools the earth’s lower atmosphere; a byproduct of a volcanic eruption known as vog contributes to such a climate shift (USGS, 2010). Sulphur dioxide, as mentioned before, reacts chemically with water, oxygen, dust particles, and sunlight; these reactions form volcanic smog which also be called vog (USGS, 2010). Eruptions of the Kilauea in Hawaii produce varying quantities of vog year round and disperse rapidly due to prevailing trade winds (USGS, 2010). The domestic and international impacts of vog will be touched on more copiously further on into this paper.
|
Water vapor or steam is the most prevalent product released into the atmosphere during a volcanic eruption. The subsurface accumulation of water occurs when there is a buildup of groundwater from rain or streams. Mass amounts of steam are ejected at high altitudes reaching into the troposphere and into the stratosphere; water then undergoes chemical reactions with gasses. Mentioned further on into this paper is the reaction in which compounds undergo with water vapor; acidic rain, for one, is a widespread product of the reaction that occurs between water and aerosols such as sulphur dioxide(SO₂) (USGS, 2010). sulphur dioxide is one of the common gasses expelled during volcanic outgassing, it is also seen being released through anthropogenic activities as well. It is the third most prevalent gas released during most outgassing events (USGS, 2010). With its molecular structure of SO₂, sulphur dioxide is formed through the covalent bonding of one sulphur atom to two oxygen atoms. Sulphur dioxide is a colorless gas but has a potent scent. Sulphur is a dissolved element within the silicate liquid present in magma. When the magma is forced up through the conduit tube onto the surface of the earth, sulphur comes into contact with our oxygenated atmosphere and becomes oxidized; sulphur then becomes sulphur dioxide (Wallace, 2001). It is estimated that volcanic eruptions release about 10 ppm of sulphur dioxide, but on some occasions there has been an outgassing of more than 20 ppm (IVHHN). The eruption of the Icelandic Holuhraun, on September 5 of 2014, saw an outstanding release of sulphur dioxide. It was reported, on average, that 60,000 tons of sulphur dioxide per day was outgassed from Holuhraun; the amount of sulphur dioxide outgassed during this episode surpassed the daily average of 14,000 tons per day of sulphur dioxide which was the amount being anthropogenically expelled into the atmosphere (Jasper, 2014). During calamitous supervolcano eruptions about 10 million tons a day of sulphur dioxide can be expelled into the atmosphere; Mt. Pinatubo on June 15 of 1991 released 20 million metric tons of sulphur dioxide into the stratosphere (USGS, 2010). Volcanically derived sulphur dioxide contributes today about 10% of present day atmospheric concentrations (Stevenson et. al., 2003).
Volcanic outgassing of sulphur dioxide(SO₂) doesn’t only deteriorate the Earth’s upper lithosphere and the lower stratosphere but ultimately influences all of earth’s individual systems; earth’s biosphere for instance is afflicted by outgassed sulphur dioxide. Sulphur dioxide as well as sulphuric acid has a detrimental impact on living organisms both terrestrial and marine. Sulphuric acid due to the fact that it is prevalent in the upper troposphere and the lower stratosphere (UTLS) has the potential to affect large areas having detrimental impacts on an international scale. When precipitated out of the atmosphere, sulphuric acid is introduced to earth’s surface resulting as acid rain (USGS, 2008). With a pH level of 2.75 in 1 mM , H₂SO₄ is more acidic than most other acids including hydrobromic(HF) and hydrochloric(HCl) acid (Aqion, 2012). Organisms composed of calcium carbonates, such as benthic reef coral and pelagic Foraminifera, are destroyed due to ocean acidification. Volcanic eruptions have the ability to deposit large quantities of sulphuric acid into marine ecosystems (IVHHN, 2014). Sulphuric acidic rain expelled over land affects large populations of terrestrial based organisms, especially humans. Figure 5 shows the amount of sulphuric acid in ppm and the affect specific concentrations of the acid have on humans (IVHHN, 2014). The United States Geological Survey states, “The World Health Organization recommends a concentration of no greater than 0.5 ppm over 24 hours for maximum exposure. A concentration of 6-12 ppm can cause immediate irritation of the nose and throat; 20 ppm can cause eye irritation; 10,000 ppm will irritate moist skin within minutes” (USGS, 2010). Sulphuric and other acids adsorbed from the gases in the plume may be present on the surface of ash particles, potentially adding to the irritancy of the ash on the airways (Baxter and Horwell. 2005).
Figure 5 – Health hazards of concentrations of sulphur dioxide (SO₂) (IVHHN, 2014)
| Exposure limits (ppm) | Health Effects |
| 1-5 | Threshold for respiratory response in healthy individuals upon exercise or deep breathing |
| 3-5 | Gas is easily noticeable. Fall in lung function at rest and increased airway resistance |
| 5 | Increased airway resistance in healthy individuals |
| 6 | Immediate irritation of eyes, nose and throat |
| 10 | Worsening irritation of eyes, nose and throat |
| 10-15 | Threshold of toxicity for prolonged exposure |
| 20+ | Paralysis or death occurs after extended exposure |
| 150 | Maximum concentration that can be withstood for a few minutes by healthy individuals |
Second to water vapor, carbon dioxide is the next leading contributor to atmospheric greenhouse gases. The massive output of anthropogenic carbon dioxide is an international pollution issue that has been extensively addressed; since the rapid escalation of carbon dioxide to its current atmospheric concentration of 395 ppm, the United Nations and other international assemblies have had the anthropogenically sourced carbon dioxide in the center of their concern (IVHHN,2014). While the carbon dioxide expelled from human activity, such as the burning of fossil fuels, is a major contributor to atmospheric greenhouse gases, it is not the only source of carbon dioxide. Volcanism also expels carbon dioxide into the atmosphere, contributing to global greenhouse gas levels. Volcanoes release up to 130 million tons of carbon dioxide into the atmosphere each year (USGS, 2010). It is averaged out that volcanism, per year, contributes anywhere between 65-319 million tons of carbon dioxide into the atmosphere (EIA, 2011). One volcanic eruption has the opportunity to outgas as much carbon dioxide in one day than 250 years of anthropogenic activity (Primer, 2010). The United States Geological Survey stated that ” Our studies here at Kilauea show that the eruption discharges between 8,000 and 30,000 metric tonnes of CO2 into the atmosphere each day” (USGS, 2007). The eruptions of the supervolcano Toba in Sumatra 75,000 years ago released up to 250 ppm of carbon dioxide on five different outgassing events (Krulwich, 2012).
Carbon dioxide, like water vapor, is one of the lightest volatiles; due to the light weight nature of carbon dioxide, this volatile is easily expelled and dispersed at the time of a volcanic eruption (Casey, 2007). Although carbon dioxide is lighter than other expelled gases, it is however heavier than air; this characteristic enables carbon dioxide to sit lower in the atmosphere (USGS, 2008). High concentration of carbon dioxide remain close to the surface of the earth; carbon dioxide is trapped under a heavier barrier of air and is unable to diffusive upward high into the atmosphere (USGS, 2010). Carbon dioxide causes widespread detrimental impacts on earth’s biosphere. When more than a concentration of 30% of carbon dioxide is inhaled, both by humans and other animal species, unconsciousness and death quickly follows (USGS, 2010). Figure 6 illustrates the quantity of carbon dioxide in ppm expelled by volcanism and the amount expelled through anthropogenic activity; it is seen that anthropogenic sourced carbon dioxide is expelled at higher ppm than volcanism, but it is also apparent that volcanism does contribute to some extend to international carbon dioxide levels (USGS, 2012).
Figure 6 – Volcanic and anthropogenic carbon dioxide emissions (USGS, 2012)
| Yearly CO2 emitters | Billion metric tons per year (Gt/y) |
| Global volcanic emissions (highest preferred estimate) | 0.26 |
| Anthropogenic CO2 in 2010 (projected) | 35.0 |
| Light-duty vehicles (cars/trucks) | 3.0 |
| Approximately 24 1000-megawatt coal-fired power stations * | 0.22 |
| Argentina | 0.20 |
| Pakistan | 0.18 |
| Saudi Arabia | 0.44 |
| CO2 emission events | |
| Mount St. Helens, 18 May 1980 | 0.01 Gt |
| Mount Pinatubo, 15 June 1991 | 0.05 Gt |
| Number of Pinatubo-equivalent eruptions equal to annual anthropogenic CO2 | 700 |
| Number of Mount St. Helens-equivalent eruptions equal to annual anthropogenic CO2 | 3500 |
High concentrations of fluorine, known as fluorosis, in an animal’s body causes the destruction of their bones (USGS, 2010). Fluorosis is a disease that occurs when an organism ingests high levels of fluorine through water or food; either through direct uptake of gaseous hydrogen fluoride or through the consumption of contaminated vegetables or water, fluorsis is easily diffused (D’Alessandro, 2006 ). Also, due to the consumption of livestock, human’s are indirectly poisoned by fluorine. When introduced to water droplets, hydrogen fluoride becomes acidic vapor. Vaporous hydrogen fluoride is rapidly absorbed into the nose and into the upper respiratory track of humans and animals alike; severe eye irritation, mucous membranes, ulcers, burning of skin, nose, throat, and lungs are symptoms when hydrogen fluoride comes into contact with humans and animals (IVHHN, 2014). When volcanic ash clouds move over bodies of water, hydrogen fluoride can be precipitated out of the cloud and into the water; the body of water then becomes contaminated with toxic levels of hydrogen fluoride. Reservoirs and ground water, in which human populations utilize, are contaminated by hydrogen fluoride; polluted water has the opportunity to effect a wide regions (D’Alessandro, 2006). Consuming water contaminated by hydrogen fluoride results in dental fluorosis which results in discolored and blackened teeth; bone and joint deformation from skeletal fluorosis is also seen in humans who consume contaminated water, vegetables, or livestock (D’ Alessando, 2006). Volcanic eruptions in Iceland outgas high concentration of hydrogen fluoride which resulted in the deaths of large sheep populations (D’ Alessandro, 2006).
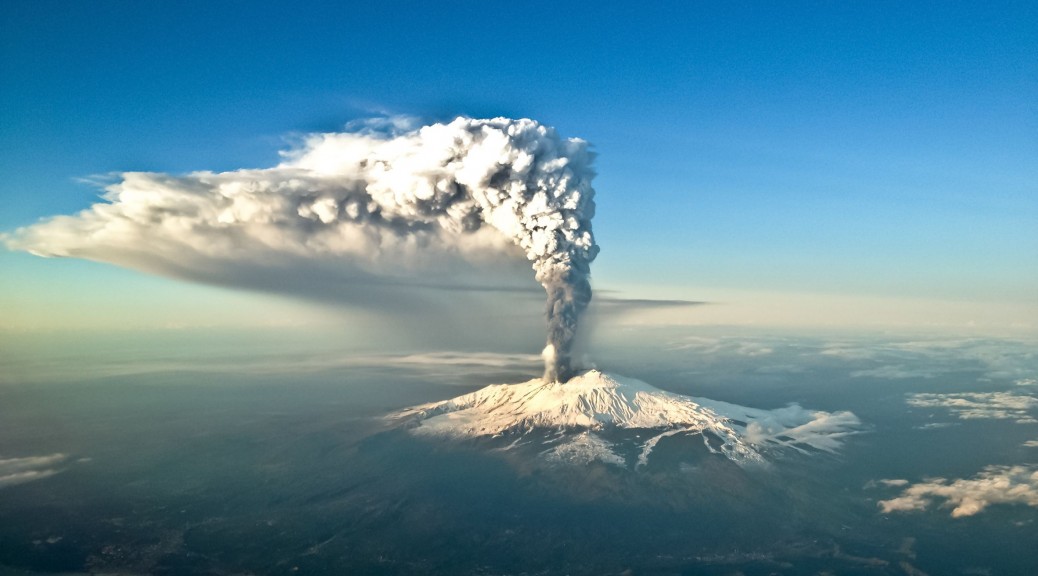
Hydrogen fluoride(HF), hydrogen chloride(HCl), and bromide oxide(BrO) are three other volcanic aerosols which also contribute to international pollution. Hydrogen fluoride and hydrogen chloride are both compounds outgassed into the atmosphere where they are then dissolve in water droplets; once these two compounds are introduced to water vapor they become hydrofluoric and hydrochloric acids where they then eventually fall toward the earth’s surface as acid rain (McGee, et. al, 1997). Hydrogen fluoride is another exceedingly harmful gas released during volcanism. Hydrogen fluoride is a very pale yellow-green reactive gas; this gas is highly reactive due to fluoride which is the most reactive of all the elements on earth (Emsley, 2011). This gas, at high concentrations, is extremely toxic. Hydrogen fluoride is absorbed into volcanic ash particulates; this characteristic provides fluorine with a rapid rate of dispersal and the high opportunity for it to come into contact with the earth’s surface. High dispersal rate is attributed to this pollutant being that it is 30% less dense than air (IVHHN, 2014). When fluoride laden ash particles settle on earth’s surface, the surrounding biosphere is detrimentally affected; when hydrogen fluoride concentrations, on earth’s surface, reach a minimal of 250 ppm, all elements of the biosphere that come into contact with hydrogen fluoride are impaired (USGS, 2010). The eruptions of Mt. Etna releases on average of 70 Gg of hydrogen fluoride each year (D’Alessandro, 2006). Hydrogen fluoride ash particulates settle on the ground and produce ash-coated grass; cattle and other livestock might consume the ash-coated grass absorbing fluorine into their bodies (Emsley, 2011).
|
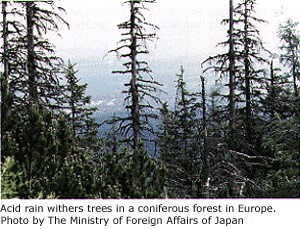
In turn, hydrogen chloride(HCl) is just as harmful as hydrogen fluoride. Hydrogen chloride when outgassed from volcanoes is poisonous; the gas has a pungent irritating odor with a yellow-green color (CDC, 2013). 3% of chlorine in the stratosphere is derived from volcanoes (Riley, 2001). Exposure to hydrogen chloride gas irritates mucous membranes of both the eyes and the respiratory system; concentration of more than 35 ppm results in throat irritation and exposure to more than 100 ppm results in pulmonary edema and laryngeal spasm(USGS, 2010). Hydrogen chloride when introduced to water droplets forms acidic rain; hydrochloric acid is an extremely strong acid (USGS, 2010). Hydrochloric acid when precipitated onto vegetation lowers the pH of the soil; soil with low pH deters the growth of plants. Agriculture is intensely affected by hydrogen chloride and other pollutants released from volcanoes(USGS, 2010). The area around volcanoes are exceedingly fertile making it beneficial for agriculture; although agriculture here is high yielding, it is susceptible to acid rain. As seen in figure 7, acid rain produced from a volcanic eruption can destroy all agriculture in its vicinity. In 2008, the eruption of Rebel Dragon in Arakan, due to the combination of volcanoes pyroclastic flow and acidic rain, destroyed 100 acres of crop land (Kyaw, 2014)
Another lesser constituent of volcanism is bromine oxide; bromine oxide is a compound that when released into the stratosphere breaks down ozone(O₃). Bromine oxide undergoes a chemical reaction with ozone where it breaks apart and takes a molecule of oxygen; ozone(O₃) becomes oxygen(O₂) (Winter, 2011). In 2010 with the eruption of Eyjafjallajökull, the amount of bromine oxide released resulted in a 84% destruction of surrounding ozone in the first hour and the 90% destruction in first 6 hours (Vance, 2010).
Cases of Volcanism
Volcanoes are spread out across the surface of the earth; although not evenly distributed, volcanism is an international occurrence. Unlike pollutions such as nuclear waste, agriculturally sourced pollutants, and plastics that are only prevalent in regions where humans produce them, volcanoes are widespread uncontrollable natural events. Volcanic activity is closely observed by the United States Geological Survey. The USGS monitors and surveys the activity of each volcano around the United States.
|

In the past 200 years, more than 50 volcanoes in the United States have erupted; sometimes more than one time. Regions most active Alaska, Hawaii, California, Oregon, and Washington. Tracking of volcanoes by the USGS is a constant and vital component in the safety of the United States. Mount St. Helen is one volcano which the USGS has been feverishly observing for decades; TDEM(Time Domain Electromagnetic and Magnetic Aerial Geophysical Survey) is one modes of observation used to keep track of volcanic activity around the United States. (USGS, 2010)
|
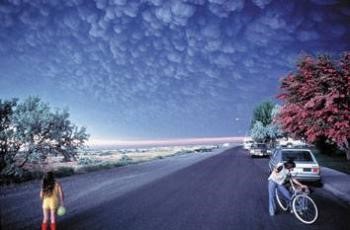
The eruption of Mount St. Helens in 1980 saw a release of a massive plume that covered an area of 600² km. The massive gas cloud was laden with sulphur dioxide; figure 8 shows the concentration of sulphur dioxide in tones per day releases from Mount St. Helen outgassed from 1980 to 2005. Up to 3750 tons per day of sulphur dioxide was released into the atmosphere. The prevailing winds moved 520 million tons of ash eastward across the United States; the ash cloud migrated across the United States in three days and reached around the world in 15 days. The eruption of Mount St. Helens in 1980 resulted in an international pollution event; figure 9 is a photograph taken from Ephrata, Washington that shows the gas cloud produced by Mount St. Helens.(USGS, 2008 and 2012)
|
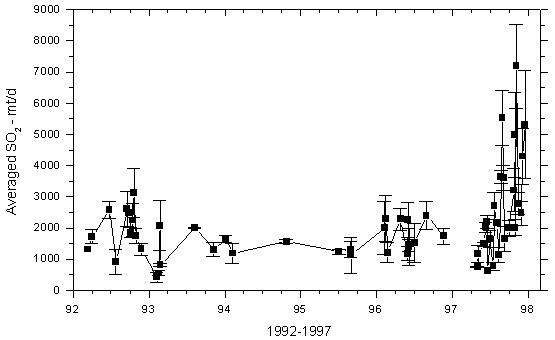
Mt Kilauea in Hawaii in 1986 was another volcanism event that had widespread international affects. The United States Geological Survey stated “At Kilauea Volcano, the recent effusive eruption of about 0.0005 km3/day (500,000 m3) of basalt magma releases about 2,000 tonnes of SO2 into the lower troposphere. Downwind from the vent, acid rain and air pollution is a persistent health problem when the volcano is erupting” (USGS, 2010). Figure 10 illustrates the rapid inclination of the concentration of sulphur dioxide emissions from the Kilauea volcano’s east rift zone from 1992-1997(USGS, 2009). The eruption of Kilauea also released a concentration of hydrogen fluoride ranging between 3-15 ppm(IVHHN, 2014). The gas cloud moved quickly, creating a rapidly expanding mass of atmospheric pollution. Northeast trade winds diffused the gas cloud over much of the southwest region of the Hawaiian island(USGS, 2009). The dense hydrogen chloride and hydrogen sulfide cloud precipitated acidic rain over the entire island; local residences around Kilauea rely on rain for drink water, but due to the corrosive nature if the acid rain lead was dissolved from buildings into the water supply(USGS, 2009). Large populations of Hawaiians were left with acidic and lead contaminated water. A high diffusion of vog also occurred at the eruption of Kilauea; residents exposed to vog developed a shortness of breath, coughing, rhinorrhea, sore/dry throat, sinus congestion, wheezing, eye irritation, and bronchitis (Longo, 2013).
|
The eruption of El Chichon in 1982 was another event that contributed greatly to pollution on an international scale. El Chichon is located in Mexico and has been an active volcano for over 2,500 years (Klemetti, 2012). The latest colossal eruption of El Chichon occurred on March 28, 1982; at its time of eruption, within 40 minutes, the plume extended up to 27 km and had a diameter of 100 km (Klemetti, 2012). Volcanic ash was deposited 13 cm thick 20 km northeast of El Chichon and 5 cm thick 70 km northeast of El Chichon; vegetation was blanketed by a layer of volcanic pollutants (Klemetti, 2012). Large loads of sulphur dioxide circled the globe for a couple of weeks; the aerosol cloud circled the globe for 3 weeks (Robock and Mao, 1994). El Chichon expelled 7 Mt of sulphur dioxide into the atmosphere (Robock and Mao, 1994). The Northern Hemisphere saw a cooling of 0.4-0.6ᵒC and the stratosphere saw a decrease in temperature of 4ᵒC (Klemetti, 2012).
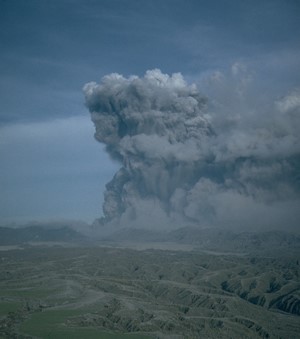
Adding further to international pollution was the eruption of Mt. Pinatubo. Mt. Pinatubo expelled a mass amount of gas in 1991, spreading aerosols worldwide; figure 11 shows the extent of the Mt. Pinatubo eruption in 1991(USGS, 2012).The eruption of Mt. Pinatubo, located in the Philippines, was the second largest eruption in the 20th century (NOAA, 2012). Mt. Pinatubo was active for 10 weeks in 1991 when it finally erupted from June 12-16 (Self et al., 1999). At the time of the eruption, in a 4,000 km² span around the volcano, 5 cm of ash was deposited on earth’s surface; crops and other plants where ignited by the mass of falling ash (NOAA, 2012). Like the eruption of El Chichon, this eruption expelled an aerosol cloud that circled the globe for 2 weeks (Robock, 2000). The sulphur dioxide gas cloud was the largest ever observed since satellites started observing volcanic activity in 1978 (USGS, 2010). Mt. Pinatubo released about 20 Mt of sulphur dioxide into the atmosphere; the eruption produced the largest stratospheric sulphur dioxide cloud that has ever been recorded (Self et al., 1999). The United States Geological Survey states “The sulfur aerosols resulted in a 0.5-0.6°C cooling of the Earth’s surface in the Northern Hemisphere. The sulfate aerosols also accelerated chemical reactions that, together with the increased stratospheric chlorine levels from human-made chlorofluorocarbon (CFC) pollution, destroyed ozone and led to some of the lowest ozone levels ever observed in the atmosphere”(USGS, 2010). The mass amount of aerosols, due to their reflective nature, resulted in 5% radiation loss in the first 10 months after the eruption; climate anomalies up to .5ᵒC occurred in 1992 (Self et al., 1999). The eruption of Mt. Pinatubo reduced ozone concentration, 20% of the ozone in a 16-25 km was reduced(Self et al., 1999).
The eruption of Krakatau in August of 1883 was recorded as the most deadly volcanic eruption in modern history; ” Within 13 days, a layer of sulphur dioxide and other gases began to filter the amount of sunlight able to reach Earth. The atmospheric effects made for spectacular sunsets all over Europe and the United States. Average global temperatures were up to 1.2 degrees cooler for the next five years”(Bagley, 2013). The plume erupted to a height of 27 km (Pararas-Carayannis, 2003). 10 cubic km of magma was expelled from the eruption of Krakatau; this eruption released 30-38 Tg of aerosols into the stratosphere in the Southern Hemisphere and 50 Tg of aerosols into the stratosphere of the Northern Hemisphere (Oregon State University, 2014). The eruption of Krakatau produced a vivid red sunset afterglow for three months that could be seen from New York; abnormal sunsets were observed for three years following the eruption (Oregon State University, 2014).The eruption of Krakatau resulted in an aerosol cloud that circled the globe for 2 weeks (USGS, 2014).
Conclusion
Volcanic derived pollution has major detrimental impacts on the earth ; the atmosphere, human/animal health, marine ecosystems, and vegetation are all equally impacted by volcanic pollution. Volcanic pollution, although not as prevent as anthropogenic sourced pollution, does have international impacts. Volcanism should not be ignored in terms of pollution; as mentioned before one volcanic eruption has the opportunity to outgas as much carbon dioxide in one day than 250 years of anthropogenic activity (Primer, 2010). Due to the fact that on average only between 50 and 60 volcanoes erupt each year, there is not nearly an adequate amount of volcanic activity to equal or to surpass the amount of anthropogenic sourced pollution (USGS, 2009). Even supervolcnoes, that have had only 8 eruption within the span of millions of years, do not have enough frequency to equalize with anthropogenic source pollution (USGS, 2014). On the occasions were volcanoes do erupt, however, aerosols and other polluting gases are dispersed quickly and expansively. The United States Geological Survey along with many other international environmental organizations recognizes the domestic and international hazards that can originate from volcanism; these organizations continually observe and analyze volcanic activity in order to minimize risk that comes with unawareness.
Pyroclastic flow at speeds of 700 km/h and ash clouds reaching up to temperatures of around 1,000ᵒC, make volcanoes one of the biggest natural hazards on this planet (Bryant, 2005). Both at domestic an international levels volcanoes have widespread detrimental impacts. On a domestic level, local agriculture, water supply, and atmosphere are inundated with ash, toxic gases, and acid rain; volcanism has similar affects on an international scale as well (USGS, 2010). Large regions of vegetation, water sources, and even infrastructure are detrimentally affected by acid rain. Populations of humans and livestock are smothered by poisonous volcanic ash and gas clouds. The atmosphere, as well, is widely affected by volcanism; global atmospheric temperatures are altered when reflective gases are expelled into the troposphere and the stratosphere (USGS, 2010). Ozone, a vital and crucial characteristic of our atmosphere, is destroyed by bromide oxide which is expelled into the stratosphere during a volcanic eruption (Winter, 2011). Volcanism is a natural uncontrollable source of pollution, unlike anthropogenic derived pollution, we cannot control or put a cap on the amount of pollution expelled.
Bibliography
Bagley, Mary. “Krakatau Volcano: Facts About 1883 Eruption”.(2013, March 26). livescience. Retrieved from http://www.livescience.com/28186-krakatoa.html – Bagley
Ball, Jessica. “Types of Volcanic Eruption”.(2005). Geoscience News and Information. Retrieved from http://geology.com/volcanoes/types-of-volcanic-eruptions/
Baxter, Peter J., Horwell, Claire J. “The Respiratory health hazards of volcanic ash: a review for volcanic risk migration”. (2005, November 30). Bull Volcano. 10(1007). Retrieved from http://www.geo.mtu.edu/~raman/papers2/HorwellBaxterBV.pdf
Bryant, Edward. “Natural Hazard”. (2005). Cambridge University Press. Port Melbourne, Australia. Print.
Casey, Timothy. “Volcanic Carbon Dioxide”.(2014, June 7). Consulting Geologist. Retrieved from http://carbon-budget.geologist-1011.net/
Center for Disease Control and Prevention. “Facts about Chlorine”.(2009, October 25). National Center for Environmental Health. Retrieved from http://www.bt.cdc.gov/agent /chlorine/basics/facts.asp
D’Alessandro, Walter. “Human fluorosis related to volcanic activity: a review”.(2006). Istituto Nazionale di Geofisica e Vulcanologia. 153(90146). Retrieved from http://www.earth-prints.org/bitstream/2122/2590/1/D%27Alessandro_EnvTox06.pdf
Emsley, John. “Nature’s Building Blocks: An A-Z Guide to the Elements”. (2011). Oxford University Press. Print
Horton, Robert J. M. and McCaldin, Roy O. “Observations on air pollution aspects of Irazu Volcano, Costa Rica”.(1964 October). Public Health Report. 79(10): 925-929. Retrieved from http://www.ncbi.nlm.nih.gov/pmc/articles/PMC1915576/?page=1
Jasper, William F. “Iceland’s Volcanic Pollution Dwarfs All of Europe’s Human Emissions”. (2014, September 26). New America. Retrieved from http://www.thenewamerican .com/index.php? option=com_k2&view=item&id=19197:icelands-volcanic-pollution-dwarfs-all-of-europes-human-emissions&Itemid=645
Johnston. “Volcanic Ash: Effects & Migration Strategies”.(2010). United States Geological Survey. Figure 4. Retrieved from http://volcanoes.usgs.gov/ash/properties.html
Krauskapf, Konrad B. “Lava Movement At Paricutin Volcano, Mexico”.(1947, September 11). U.S. Geological Survey. 59(1267-1284). Retrieved http://gsabulletin.gsapubs.org/content/59/12/1267.
Krotkov, N. A., Schoeberl, M. R., Morris, G. A., Carn, S., and Yang, K. “Dispersion and lifetime of the SO₂ cloud from the August 2008 Kasatochi eruption”. (2010). Journal of Geophysical Research. 115(1-13). Retrieved from http://so2.gsfc.nasa.gov/pdfs/Krotkov_2010JD013984.pdf
Krulwich, Robert. “How Human Beings Almost Vanished From Earth In 70,000 B. C.”(2012, October 22). Krulwichwonder. Retrieved from http://www.npr.org/blogs/krulwich/2012/ 10/22/163397584/how-human-beings-almost-vanished-from-earth-in-70-000-b-c
Lamb, Robert. “How is volcanic ash made?” (23 September 2008). HowStuffWorks. Retrieved from http://science.howstuffworks.com/dictionary/petrology-terms/volcanic-ash.htm
Longo, Bernadette M. “Adverse Health Effects Associated with Increases Activity at Kilauea Volcano: A repeated Population-Based Survey” (2013, July 25). Hindawi Publishing Corporation. 475962. 10. Retrieved from http://www.hindawi.com/journals/isrn/2013/475962/
McGee, Kenneth A., Doukas, Michael P., Kessler, Richard., and Gerlach, Terrence M. “Impacts of Volcanic Gases on Climate, the Environment, and on People”.(1997, May). United States Geological Survey.97(262). Retrieved from http://pubs.usgs.gov/of/1997/of97-262/of97-262.html
National Oceanic and Atmospheric Administration. “Mt Pinatubo, Philippines: Ash Cloud”.(2012, February 7). NOAA. Retrieved from http://www.ngdc.noaa.gov/hazard/stratoguide/pinfeat.html
Pararas-Carayannis, George. “Near and far-field effects of tsunamis generated by the paroxysmal eruptions, explosions, caldera collapses and massive slope failures of the Krakatau volcano in Indonesia on August 26 27, 1883″. (2003). Tsunami Society.21(4). Retrieved from http://www.wired.com/2012/ 03/looking-back-at-the-1982-eruption-of-el-chichon-in-mexico/
Riley, C. M. “Volcanic Gases”.(2001).United States Geological Survey at CVO. Retrieved from http://volcano.oregonstate.edu/book/export/html/151
Schmincke, Hans-Ulrich. “Volcanism”. (2004). Springer-Verlag Berlin Heidelberg. Germany. Print.
Stevenson, David. S., Johnson, Colin E., Collins, William J., and Derwent, Richard G. “The Atmospheric Sulphur Cycle and the role of Volcanic SO₂.(2003)”.The University of Edinburgh. (1-21). Retrieved from http://www.geos.ed.ac.uk/~dstevens/Presentation s/Papers/stevenson_gssp03.pdf —-Stevenson
Self, Stephen., Zhao, Jing-Xia., Holaesk, Rick E., Torres, Ronnie C., and King, Alan J. “The Atmospheric Impact of the 1991 Mount Pinatubo Eruption”.(1999, June 11).United States Geologic Survey. Retrieved from http://pubs.usgs.gov/pinatubo/self/
Sammonds, Peter., McGuire, Bill., and Edwards, Stephen. “Volcanic Hazard From Iceland: Analysis and Implications of the Eyjafjallajökull Eruption”.( 2010). University College of London Institute for Risk and Disaster Reduction,. (1- 21). Retrieved from http://www.ucl.ac.uk/rdr/documents/docs-publications-folder/icelandreport
Vance, Alan., McGonigle, Andrew J. S., Aiuppa, Alessandro, Stith, Jeffery L., Turnbull, Kate, Glasow, Roland. “Ozone depletion in the tropospheric Volcanic plumes”. (2010, November 18). Geophysical Research Letters. 37(22802). Retrieved from http://onlinelibrary.wiley.com/doi/10.1029/2010GL044997/pdf
Wallace, P.C. “Volcanic CO₂ emissions and the abundance and distribution of exsolved gas in magma bodies”. (2001). Journal of Volcanology and Geothermal Research. 108(85-106). Retrieved from http://www.geo.mtu.edu/~raman/papers2/Wallace01JVGR.pdf
White, Mark. “Bromine: reactions of elements”. (2011). The University of Sheffield and WebElements. Retrieved from http://www.webelements.com/bromine/chemistry.html
“Annual Energy Review”.(2011). U. S. Energy Information Administration. Retrieved from http://www.eia.gov/totalenergy/data/annual/index.cfm
“How Volcanoes Work: Volcanic Gases”.(2000). San Diego State University, Department of Geological Science. Retrieved from http://www.geology.sdsu.edu/how_volcanoes_work/Volcanic_gases.html
“pH of Common Acids and Bases”.(2012). Aqion. Retrieved http://www.aqion.de/site/191
“Which produces more CO₂, volcanic or human activity?”.(2007, February 15). United States Geological Survey. Retrieved from http://hvo.wr.usgs.gov/volcanowatch/archive /2007/07_02_15.html.
“Volcanic Sulfur Aerosols Affect Climate and the Earth’s Ozone Layer”.(2008, October 11). United States Geological Survey. Retrieved from http://volcanoes.usgs.gov/hazard s/gas/s02aerosols.php
“Types of Volcano Hazards”.(2014). United States Geological Survey. Figure 1. Retrieved from http://volcanoes.usgs.gov/hazards/
“Volcanic Ash: Volcanism”.(2011). University Corporation for Atmospheric Research. Figure 2. Retrieved from http://www.goes-r.gov/users/comet/volcanic_ash/volcanism/print.htm
“Volcanic Gases and Their Effects”.(2010). United States Geological Survey. Figure 3. Figure 11. Retrieved from http://volcanoes.usgs.gov/hazards/gas/
Durham University. “Sulfur Dioxide (SO2)”. (2014). The International Volcanic Health Hazard Network. Figure 5. Retrieved from http://www.ivhhn.org/index.php?option=com_content &view=article&id=82
“Volcanic Gases and Climate Change Overview “.(2012). United States Geological Survey. Figure 6. Retrieved from http://volcanoes.usgs.gov/hazards/gas/climate.php
“Acid Rain: Do you need to start wearing a rainhat?”.(2014, March 17). United States Geological Survey. Figure 7. Retrieved from http://water.usgs.gov/edu/acidrain.html
McGee, Kenneth A. and Casadevall, Thomas J. “A Compilation of Sulfur Dioxide and Carbon Dioxide Emission-Rate Data from Mount St. Helens during 1980-88”.(2001, March 1). United States Geological Survey. Figure 8. (92-212). Retrieved from http://pubs.usgs.gov/of/1994/of94-212/Derived/report.html
“1980 Cataclysmic Eruption”.(2013, February 7).United States Geological Survey. Figure 9 Retrieved from http://volcanoes.usgs.gov/volcanoes/st_helens/st_helens_geo_hist _99.html
“Volcanic air pollution, Kilauea Volcano, Hawai’i”.(2009, December 29).United States Geological Survey. Figure 10.Retrieved from http://volcanoes.usgs.gov/hazards/gas/ volgspollution.php