

By: Fahad Huq | December 2014
Abstract
Over the past three decades, the global market has shift tremendously following a production and consumer boom the likes of which have never been seen. The United States has seen China, Japan, India, and Russia rise to become economic superpowers. Of these nations, China and India have had the most rapid economic growth, and with their economic powers expanding, so has their energy usage. Greenhouse gas emissions have steeply increased in the past three decades. Over 32 trillion metric tons of Carbon Dioxide were released in 2012 by the international community. almost 13 trillion tons came from the United States, China, and India (EIA, 2014). These global economic superpowers are essential to determining the future of earth’s climate. Their actions to curb emissions will have a slow start, but expectations from current pledges show a better world ahead.
Key Words: Coal, China, India, United States, Europe, Enegry production, GDP, Greenhouse Gas Emissions. Industrialization.
The Graduation of the World
The European Union has lowered its energy usage to the same levels it had at 1995. Whereas China has become the largest importer and user of energy in every sector, primarily oil, in the world, surpassing the United States (BP, 2013).
The world as we know it is changing. Markets are shifting from a west-dominant field to a truly globalized arena as Asia, Australia, and even nations throughout South America gain ever-increasing stock in the global economy. China is no longer the only name on the board for amazing-growth nations as India, Brazil, and Australia are becoming ever-present in the constantly shifting tide of global power.
When the first images of planet Earth were beamed back from spaceships, the United States lit up like a Christmas tree. Now, Asia and South America have higher energy demands than the United States has seen in a long time; and theirs is a growing thirst. World Energy usage has increased by 2.3%, a seemingly small number, yet where the demand is growing is anything but a small issue. China now imports 63% of it’s oil (BP, 2013). In terms of consumption rates and import rates, India almost rivals China’s demands, though it still has lower numbers than its neighbor (EIA, 2013).
The pressure on fuel demand to meet these staggering growth rates is extreme. Although the EU and Japan have been receding their energy usage by 0.6% and 0.9% respectively, the rest of the much larger world is hungrier than ever for fuel. In 2013, an otherwise declining CO2 emissions scale had tipped over to positive. India has seen its demand for Coal go higher and higher, and though it is still the third largest producer of Coal, it is now the third largest consumer after China and the United States. Natural Gas is seeing it’s hay-day, and Russia is making it’s money by exporting most of it to the world (BP, 2013).
Previously titled “Developing Nations”, many of the biggest players in the energy usage sector of the world are countries that are now in a phase of “Graduation” (Hurrel, Sengupta, 2012). These countries have grown from Emerging Nations to Emerging Powers. The future of energy usage is going to rely on the policies and practices of established and emerging powers as both sides adopt newer technologies, rising demands, growing pressure to go green, and ever worsening climate change. Energy usage is projected to rise across the globe, with a lot of development going towards renewables, investments in which could rise by upwards of 27% of current standards (Isola, 2013).
Economic expansion and power generally correlates with energy usage. Energy usage correlates exactly with Greenhouse Gas emissions. The world’s top five economies, The United States, the EU-27, China, India, Japan, and Russia are also the top five emitters of Greenhouse Gases. In fact, they almost follow the same order in terms of emissions, except that Japan and Russia switch places on that scale (EIA, 2014). It is important to study economic trends in order to better understand the way in which our climate changes. Energy production and economic productivity have gone hand in hand; but a correlation of economic productivity and Greenhouse Gas emissions may not have to. With a study of changing economic trends coupled with an understanding of how nations produce energy, a better picture of the future of global climate can be drawn.
Emergence of Giants
Three decades ago, China and India began to expand their closed economies towards becoming participants in the global market. Today, China is the second largest economy in the world, and India is the third, based on Gross Domestic Product (World Bank, 2014). In three decades, the global economy has changed drastically. In 2010, China became the second largest importer and the largest exporter on earth. China’s GDP has grown by tenfolds in two decades. India is one of the largest producers of services in the world (Forbes, 2014).
The two Asian nations began their expansion in similar ways, but have come to success and economic domination two very different entities. China’s growth began by the closed state-run economy moving out of collectivized agriculture as the primary production of the nation. Decentralization of the economy and an increase in fiscal decentralization, autonomy of enterprise allowed for businesses to grow that didn’t’ solely serve the communist state. in order to emerge in to the global market, China opened a stock market that allowed private ownership of businesses both domestically and by international investors. Once a modern banking system was adopted, many industries flocked to invest in China. by the 1990’s, China had a booming industrial complex. The nation’s large population below or nearing the poverty line supplied a tremendous amount of cheap labor. Soon, most global industrialization was being outsourced to China. In 2001, China surpassed Japan to become the second largest economy in the world. Coupled with the nation’s expansive agricultural sector specializing in staple crops such as rice and wheat, China saw itself transformed into the single largest exporter of finished products. Over the past decade, the nation’s massive growth in industry has created the largest expansion in the middle class since World War II. China’s growth is expected to continue as it develops systems for domestic trade to accommodate its growing middle class and upper class (Forbes, 2014).
India saw a similar growth to China. In the 1980’s, traditional farming methods continued side by side with modern agricultural practices. A further deregulation of the industrial sector allowed for cheap labor from the nation’s massive population to fuel production and processing of textiles and agricultural products for the global market. Privatization of state-run services and lands allowed for international investment to pour in to the country. However, it was not until the tech boom of the late 1990’s that India saw its explosive rise. Many nations were moving their primary production to China, but still paying high costs domestically for their service-based businesses. India had a large English speaking population following British colonization and India’s independence in 1947. International firms heavily invested in Indian cities and recruited much of the nation’s English speaking population to staff mobile service-based industry and information technology services. The influx of foreign investment bloated India’s service sector and the economy thrived. India’s growing entertainment sector also employed a large portion of the population, and is internationally profitable (Forbes, 2014).
The two enormous economies have become so in very short periods of time. This rapid expansion has left both nations with significant problems at the social and economic tier. India saw a rise in its inflation rate and political unrest following the fiscal crisis of 2008, which drew a lot of international investment out of the country as a result of increased risk. Moreover, India has major social and human rights issues. A reported 12% of the Indian children under the working age have been involved in India’s child-labor force (Paul, 2014). Rapid infrastructural expansion has allowed many of its rural populations to migrate to cities in order to look for new jobs, despite almost half of the GDP originating in agriculture. Corruption is rampant, and the Indian government is under pressure to pass and uphold significant reforms. China is seeing a major migration within its borders as most of the population flocks to the North East in search of jobs. Around 250 million Chinese migrated to urban centrals and agricultural provinces in the Chinese North East. China’s rapid growth in manufacturing and agriculture has quite literally drained its water reserves. A falling water table, coupled with toxic pollution, has created a dire situation from an environmental perspective (Forbes, 2014).
The Tragedy of the Commons
.“Each man is locked into a system that compels him to increase his herd without limit–in a world that is limited. Ruin is the destination toward which all men rush, each pursuing his own best interest in a society that believes in the freedom of the commons. Freedom in a commons brings ruin to all.” (Hardin, 1968)
The above is the inspiration and first lesson for every aspiring Environmental Economist. Garret Hardin’s Tragedy of the Commons is 1968 argument that has now become fable in the Sustainability industry. What it essentially tells us is that when a resource that is limited is used without restrictions or management; it will eventually be depleted to the harm of its consumer. As the grass pastures are important to sheep herds, the environment is important to the Human race. It is both an economic, aesthetic, and a vital resource that currently has few management policies for its uses.
Global warming is caused by a buildup of Greenhouse Gases in the atmosphere. The primary source for GHG’s still remains the energy industry, clocking in for 32% of all emissions by the sector alone in 2012 (EPA, 2014). Fossil Fuel usage is attributed to this emission from sources such as Coal, Oil, and Natural Gas. Although a strong case can be made for the reduction of GHG’s in other sectors, one thing remains clear; global emissions of GHG’s and accelerated climate change are directly linked and heavily influenced by Fossil Fuel usage in the energy sector.
Greenhouse Gases directly affect the air commons. Climate Change has its roots in natural cycles and sources; but it is being thoroughly accelerated by the energy sector. As the world changes and economic powers rise, so does pollution across the world; directly increasing the effects of global warming that include drought, increase in natural disasters, increase in severe weather events, and rising sea levels. The primary issue with pollutants in the air are that many tend to remain there and build up in concentration. Although there are natural and often anthropogenic measures in place for sequestration of CO2 and other Greenhouse Gases, there exists no system that is capable of sequestering Greenhouse Gases from the atmosphere at the rate in which anthropogenic use of Fossil Fuels are adding them to the atmosphere. Moreover, increasing Greenhouse Gases can have positive reinforcement cycles that release even more of the pollutants into the air. For example, rising temperatures in the polar regions is causing thaw of arctic and antarctic ice. In the Northern Hemisphere, melting permafrost is releasing large amounts of volatile Methane gas in to the air. Permafrost is essentially ice covered with soil. Due to high latitudes and soil insulation both above and below, permafrost is frozen year around. By being so, enormous amounts of Greenhouse Gases are trapped in the ice below the soil. Once melted, gases are released from permafrost back in to the atmosphere. Methane is a stronger Greenhouse Gas than CO2. Permafrost also contains high levels of CO2. Since 1980, permafrost thawing has doubled in speed (Upton, 2014).
Climate Change directly related to increases in Greenhouse Gases in the atmosphere from anthropogenic activities also contribute to elevating a very powerful threat already damaging essential parts of our planet. Drought can be a significant byproduct of temperature escalations. The Western United States and Northern China have already experienced major droughts in the past decade (Larson, 2014).
The air commons need to be saved by reverting to energy sources that cause less harm over the long run.
Fuel Usage by Source
In the United States, 4 trillion kilowatt hours of electricity was generated in 2013.
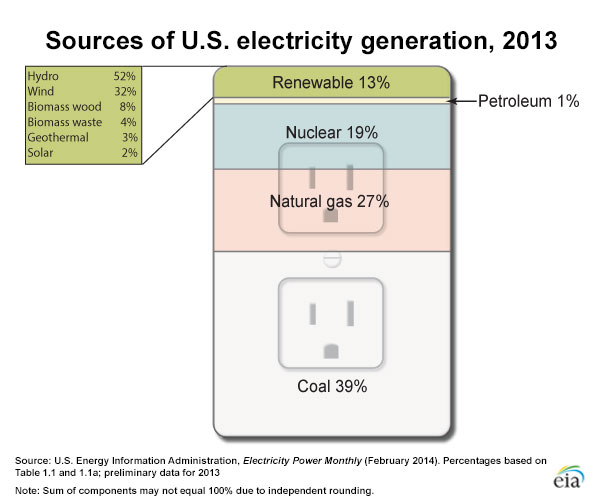
Coal was responsible for 39% of energy output.
27% of U.S. electricity came from Natural Gas usage.
1% came from Residual Fuel Oil; the type of Petroleum used in energy production only. In total, 67% of U.S. energy output was produced by Fossil Fuels alone. Coal is the single largest emitter, by weight, of Greenhouses gases including CO2, and Methane. The remaining 33% of U. S. energy usage was sourced from Nuclear (20%) and Renewables such as Hydropower (7%), Wind (4%), Biomass (<1%), Geothermal (>1%), and Solar (>1%). (EIA, 2014).
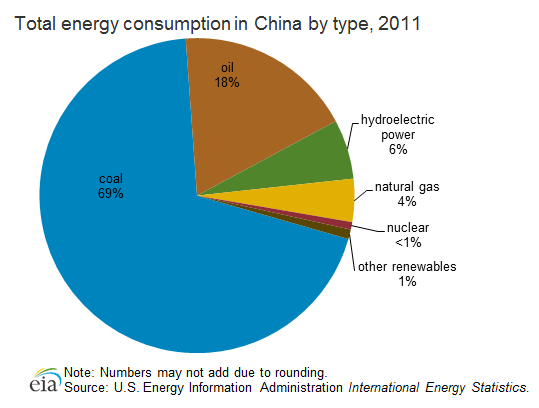
In China, most of energy is produced by means of Coal, with 69% of China’s electricity being generated by Coal. Renewables currently count for around only a single percent of China’s net electricity production. China still operates oil-based powerplants, although they are mostly used to power industrial factories. Natural gas plays a small role in China, and is seeing slight growth from the 4% total of 2011. Hydroelectric power has always had a significant role in China’s power production, and holds at 6% of total energy output. Nuclear power usage in China is very low at less than 1% total net electricity generation (EIA, 2013).
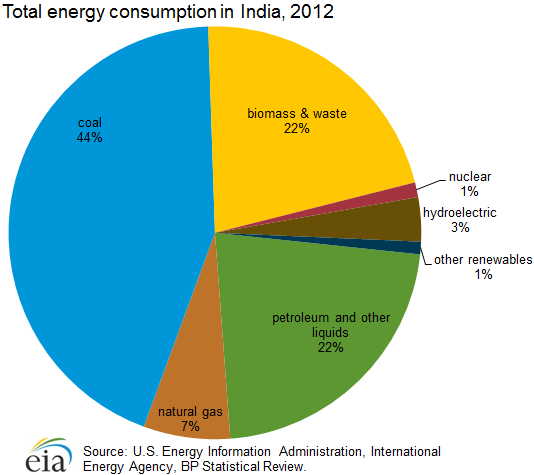
India derives 44% of it’s energy from Coal. Though this may sound like good news, in reality, India supplants what Coal it doesn’t burn by use of biomass and waste. Coal is also on the rise as a fuel source in India. Biomass is a source of energy particular to India; most of which is rural and unlike China, does not contain a massive dessert. India still burns a tremendous amount of wood and other organics such as dried animal feces and straw for the production of its domestic wastes. Although much of this is done by small families, some factories in India still use wood to either power the factories or fuel fires. This contributes to a 22% energy production share to a rare yet significant Fossil Fuel. Petroleum holds out at an equal 22%, and Natural Gas (of which India has good deposits) stands at 7%. Though India is expanding its Nuclear Programs, only 1% still comes from nuclear reactors. India has a large river system and can therefore rely on receiving 3% of its power from Hydroelectricity. Renewables have only a 1% contribution to the nation’s energy output (EIA, 2013).
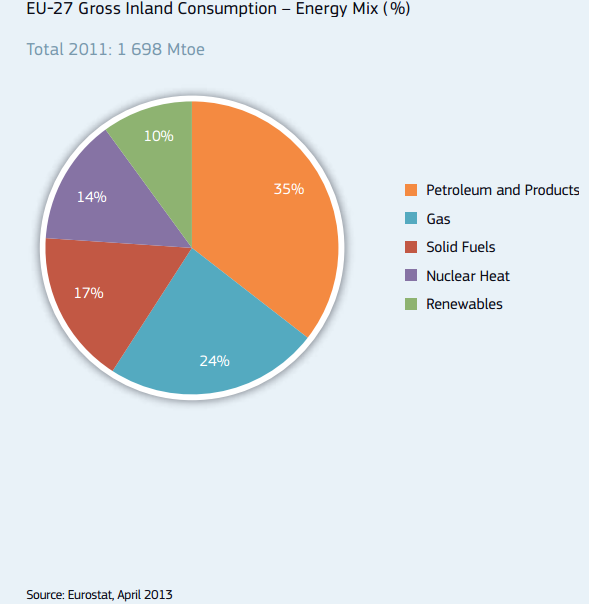
Natural Gas is noticeably big in Europe. 24% of total energy consumption comes from Natural Gas. several European nations, particularly Russia, are significant producers of Natural gas. In Europe, it is hailed for its relatively low Greenhouse Gas emission. Europe keeps the lowest reliance on Coal at 17%. Use of Coal in Europe has recently been predicted to increase as petroleum, Europe’s largest source of fuel, is technically expensive in the oil-parched region. Coal is priced on a global-market, and transportation over land and sea are a reason for this as the solid fuel source cannot be transported in any other way. Oil, on the other hand, can be transported via pipelines, and is therefore priced on a regional basis. Generally oil has been a significant source for Europe’s power generation but increases in oil prices during the years following the 2008 financial crisis has made cheap coal a more attractive option to much of Europe. This is also during a time when most European nations are striving for a shift away from Fossil Fuels. Because of this, it is expected that a shift towards using more coal is only temporary in Europe (The Economist, 2013). Europe still derives 35% of its electricity from Petroleum based fuels. Nuclear energy, a long-time favorite of many large European nations, takes the third place at 14%. This number is also expected to decrease since some European nations, Germany in particular, plan to shift completely off Nuclear (The Economist, 2013). A staggering 10% of European power comes from renewables, and Europe has low dependence on hydroelectricity, making Europe’s renewable energy matrix truly sustainable (Eurostat, 2013).
Shifting Sands
Fall of 2014 saw the international energy market go through some major changes. Primarily, The United States overtook Saudi Arabia as the single largest producer of crude oil in the world. This significant change came somewhat unexpectedly. Oil had been priced with relative stability, albeit with a positive growth trend, since 2009. In the few six months leading to December, oil prices fell by 40$ from $115 a barrel to $70. The Organization of Petroleum Exporting Countries, or OPEC, which produces 40% of the world’s total crude oil, is no longer seen as the only controller of the global oil market. This significant change in the United States’ role as the largest oil producer in the world had to do with an explosion in North American Hydrofracking and Shale Oil processing. The United States does not export any crude oil, but it imports significantly less than it used to. This comes at a time when global demand for oil is at a low, and most of the world’s energy production is relatively efficient compared to in the past. The method by which OPEC regulates oil prices is by adjusting its production quota. In 2014, Saudi Arabia refused to lower its production quota, and global oil prices plummeted. Although some OPEC nations, specially Saudi Arabia, have large cash reserves, many oil exporting nations do not. It is speculated that the Saudi’s cause for refusing to lower oil prices was to keep market share from unfriendly competitors Russia and Iran – both of whom have fiscal issues (Economist, 2014).
This significant drop in the price and demand for crude oil globally is a key indicator of the current energy consumption trend away from Fossil Fuels.
Projected and Current Emissions of GHG’s
The elephant in the room of international energy usage growth is the pressing matter of climate change. Oil and Coal, the reigning champions of fuel around the world at 33% and 30% of all fuel used, respectively (BP, 2013), are the biggest emitters of Greenhouse Gases. Coal provides 40% of global fuel to generate electricity, followed by Hydroelectric and Nuclear (WorldCoal, 2014). GHG’s such as CO2 and methane are accelerating a shift in the way our climate behaves as overall temperatures rise, causing more frequent and drastic severe weather events. Moreover, GHG’s are only a single component in the pollution spectrum produced by Fossil Fuels such as Coal and Oil.
The United States became the largest net exporter of crude oil in 2014, surpassing Saudi Arabia while China has become the largest importer of crude oil, surpassing the United States (Reuters, 2014). China is the biggest name in Coal, consuming most of it in the world and producing three and a half times more than it’s closest companion, the United States.
Acknowledging the significant need to reduce GHG emissions, nations met at Copenhagen in 2009 to set ambitious targets to reduce their aggressive emissions. Emerging powers put down biggest goals, with China projecting a decrease by 40% to 45% below 2005 emissions levels by 2020 (Hurrel, Sengupta, 2012). More recently, China has struck an accord with the United States to taper off it’s emissions following expansions until 2030, stating that by 2030 20% of it’s total energy output will be from non-Fossil Fuel sources. China has also set to cap it’s coal usage in 2020, a policy that will drastically reduce expansion in it’s Coal industry which is currently the highest in both energy production and GHG emission (Wong, 2014).
Lima and Onwards
There is a fervent trend amongst all nations to significantly reduce their GHG emissions. Leading the movement is the European Union, which has been investing in renewables for decades. China has pledged to spend $473 billion in development of renewable energy sources, and currently leads the world in investments in renewables (Perkowski, 2014).
In the first two weeks of December, 2014, the Conference Of the Parties to the United Nations Framework on Climate Change took place in Lima, Peru. The conference brought together over 190 nations and over 11,000 delegates to discuss the future of global climate. At its 20th anniversary, the conference was a major discussion point for the Paris climate talk in late 2015. This year’s conference in Lima had small but significant changes to past episodes. Instead of playing an international blame-game, the conference hosted realistic discussions on mitigating climate change and adapting to the inevitable changes that would be brought about from existing climate change. Frameworks were put in place in order to investigate nations’ emissions and practices in a new “Multilateral Assessment;” a key step forward in determining the impact of small but heavily industrialized nations on global climate. Moreover, nations also pledged significant monetary contributions to several new funds and programs created with a strict focus on mitigating and adapting to climate change. Lima-based Green Climate Fund received $10.2 billion in pledges and contributions from present states. Germany pledged a contribution of 55 million Euros to the Adaptation Fund; a Fund dedicated towards helping developing nations meet and instill adaptive measures to present climate change trends. The conference even included a program that would expand education on climate change as a part of the national educational curriculum of Peru. Nations concluded the conference by creating a major guideline for the agreement that will be taking place in Paris by proposing Intended Nationally Determined Contributions, or INDC’s, that will form the benchmarks of proposed action after 2020, which is when the 2015 agreement in Paris will take effect at the 21st convention of the panel (UNFCCC, 2014).
Renewable electricity accounted for 35% of the growth in global power generation in 2013. Although it only counts for 5.3% of global electricity generation, such a staggering growth rate is a great indication on the future of renewables. Primary EU countries with the exception of Great Britain are becoming ever-less reliant on Fossil Fuels for their primary energy sources. The EU is projecting an overall decrease in energy usage by 20% by 2020 (Eurostat, 2014). Many of it’s smaller member states such as Latvia, Sweden, Finland, and Austria have seen expansions in their renewables by 30% to 37%. This is while the overall EU energy consumption is already decreasing; indicating an energy future for the EU that is not just energy efficient, but environmentally friendly. Europe has also seen the largest percentage growth of renewables as part of its energy mix, doubling to 10% from 5% within the years from 1995 to 2011 (EU, 2013). Many nations have adopted policies and have projected decreases in Greenhouse Gas emissions. Germany has led the charge here, quite excitedly, since 2000. It introduced a plan known as “Energiewende,” which stands for “energy change.” This plan outlines reductions of Fossil Usage in the country by 80% by 2050. This is to be fueled by huge government subsidies towards any businesses related to decreasing Greenhouse Gas emissions. Though this program has been costly, Germany’s fervent dedication towards emissions has helped Europe accelerate their emissions reductions (FT, 2014).
In the United States, Renewables don’t exactly carry center stage, but are seeing growth regardless. Wind energy leads the growth of U.S. renewable usage in terms of market share, but solar energy is expected to dominate growth. Though the U.S. is primarily growing its production capacity for Natural gas, Renewables will make up 24% of energy production capacity growth by 2040 (EIA, 2014). In November of 2014, President Barack Obama and Chinese President Xi Jinping met to discuss their nation’s goals. President Obama pledged to cut U.S. emissions by 17% of 2005 levels by 2020, and reach 26% decrease by 2025. The Chinese President declared that China would maximize its emissions by 2030, and then taper off emissions to below 2005 levels. President Xi also said that China will reach 20% of renewables as its energy mix by 2030 (Lynch, Mattingly, 2014).
India is under tremendous international pressure to slow its expansion in to Fossil Fuel usage. It is expanding its use of coal almost at China’s speeds. Current projections are for India to include renewables in its energy mix more aggresively than it is right now. This is a significant challenge, as most of India is not on an energy grid, and Prime Minister Modi has pledged to have his country connected fully within his administration. The best and cheapest way of doing this would be to use coal. India faces not only a moral dilemma, but one of economic constraints (Koch, 2014).
Conclusions
Global powers have shifted. The United States and Western Europe are no longer the only dominant economies. The three superpowers of the world, China, India, and the United States, are producing money at unprecedented levels, but falling behind in curbing their Greenhouse Gas emissions. As they plunge the world deeper in to a climate crisis, there is hope on the horizon. With aggressive reduction plans, and with Europe spearheading a possible green revolution, a rising global market for renewables is possible. If the energy usage trends globally succeed in being more environmentally friendly, sustainable development may transcend in to economic progress as well as general well being for the entire planet.
Works Cited
Caiazza, Tom. 2014, December 1. CAP Report Shows that Clean Power Plan Will Mitigate Rising Demand for Natural Gas, Urges States to Set Ambitious Goals for Renewables and Energy Efficiency. Center for American Progress. Retrieved on 12-4-2014
Enerdata. 2012, May 24. Sluggish growth of World energy demand in 2011. Enerdata. Retrieved on 12-4-2014
Energy Information Administration. 2014, May 7. Annual Energy Outlook 2014. Energy Information Administration. Retrieved on 12-4-2014
Energy Information Administration. 2014, August 12. Electricity in the United States; Basics. Energy Information Administration. Retrieved on 12-4-2014
Environmental Protection Agency. 2012. Sources of Greenhouse Gas Emissions. Environmental Protection Agency. Retrieved on 12-4-2014
Fahey, Jonathan. 2013, June 26. Renewable Energy Growth Is Rising Around The World, IEA Says. The Huffington Post. Retrieved on 12-4-2014
Financial Times. 2014, November 25. The Growing Absurdity of German Energy Policy. Financial Times. Retrieved on 12-4-2014
Foley, Todd. 2014, December 10. How Green Is Barack Obama? Politico Magazine. Retrieved on 12-14-2014
Forbes. 2014. China. Forbes. Retrieved on 12-23-2014
Forbes. 2014. India. Forbes. Retrieved on 12-23-2014
Forbes. 2014. United States. Retrieved on 12-23-2014
Hardin, Garrett. 1968, December 13. The Tragedy of the Commons. Science. Vol 162 No. 3859 pp 1243-1248
International Energy Agency. 2014. Coal. International Energy Agency. Retrieved on 12-4-2014
Isola, James. 2013, April 22. Strong Growth For Renewables Expected Through to 2030. Bloomberg New Energy Finance. Retrieved on 12-8-2014
Kahn, Brian. 2014, August 29. Climate Change Ups Odds of a Southwest Megadrought. Climate Central. Retrieved on 12-18-2014
L., E. 2014, December 8. Why the oil price is falling. The Economist. Retrieved on 12-23-14
Larson, Christina. 2014, August 15. Severe Drought In China’s Northern Bread Basket Threatens Harvests. Business Week. Retrieved on 12-18-2014
Lomborg, Bjorn. 2014, December 10. How Green Is Barack Obama? Politico Magazine. Retrieved on 12-14-2014
Paul, Akhil. 2014, April 6. Is India Still a Developing Country? The Guardian. Retrieved on 12-23-2014
Reuters. 2014, October 15. U.S. surges past Saudis to become world’s top oil supplier -PIRA. Reuters. Retrieved on 12-4-2014
Revkin, Andrew. 2014, December 14. At Climate Talks in Lima, Not “Same As it Every Was?” New York Times. Retrieved on 12-23-2014
The Economist. 2013, January 3. The Unwelcome Renaissance. The Economist. Retrieved on 12-23-2014
United Nations Framework Convention on Climate Change. 2014, December 14. Lima Call for Climate Action Puts World on Track for Paris 2015. United Nations Framework Convention on Climate Change. Retrieved on 12-23-2014
Upton, John. 2014, September 12. The Good and Bad Climate News from Permafrost Melt. Climate Central. Retrieved on 12-23-2014
Wile, Rob. 2013, December 16. Solar And Wind Growth Will Blow Away All Other Energy Sources In The US In The Coming Decades. Business Insider. Retrieved on 12-4-2014
Wong, Edward. 2014, November 20. In Step to Lower Carbon Emissions, China Will Place a Limit on Coal Use in 2020. The New York Times. Retrieved on 12-23-2014
Koch, Wendy. 2014, November 25. In Climate Talks, Spotlight Turns to India. National Geographic. Retrieved on 12-23-2014.