
Agricultural Runoff in the Mississippi River Basin
Author: Morgan Schacker | December 2014
Abstract
As industrial agriculture progresses in the open lands of the United States, marine ecosystems are deteriorating in the Gulf of Mexico. Where the waters once glistened just south of Louisiana, increased fertilizer usage is allowing nutrients to flow rapidly into the waters of the Mississippi River and spilling into the Gulf. Excess nutrients, including nitrogen and phosphorous, combined with regional circulation and water stratification has caused the discharge area below the Mississippi River Basin to become hypoxic. The area affected currently stretches 5,000 square miles, but has been much larger in past decades. The dead zone is of the largest on Earth, second only to the Baltic Sea. The nitrate flux promotes rapid algae growth, which in turn removes oxygen from the water column. The resulting decline of marine wildlife is not just environmental, but economic. Major fishing industries are suffering in the United States, as well as in Mexico. Recent research has pushed academics to find a solution. A main issue blocking the road to resolution, is the vast amount of non-point sources runoff originates from. Several cities lay on the channels that flow into the Mississippi river as well as countless industrial facilities and a multitude of agricultural farms. Progress will come from improved agricultural processes and enhanced technologies for filtering runoff, including soil and water management. Still, there is no one solution, and all involved polluters must come together to systematically promote better-quality practices.
Keywords: HABs, Eutrophication, Nitrogen, Phosphorus, Dead Zone, Runoff
1. Introduction
Industry and development has thrust our planet into a realm of polluted waters, smog-filled air, destruction of forests and countless extinctions. Agriculture in the past century has swelled our view of the world of food, but contemporary industry is harming the planet faster than we can pick up a loaf of bread. The massive crop and livestock productions in the Midwest are causing profound environmental consequences in the Gulf of Mexico – via the Mississippi River. Fertilizers and pesticides leach through soils and groundwater leading to runoff, and many current ecosystems are at risk. The advances of globalization, while beneficial to the economy, are driven by an exploitation of Earth and are not sustainable at their current rate.
2. Agriculture
At the turn of human evolution, agriculture was transforming our hunter-gatherer societies into living, working industrial civilizations. Hunger was an entity of the past, and food quickly became widely available approximately 8,000 years ago. Crop cultivation changed everything, and until the approach of the industrial revolution, most human populations labored in agriculture. Yet in the past couple of centuries, agriculture has continued to dominate the economy of the Midwestern United States. Consisting of 12 states: Illinois, Indiana, Iowa, Kansas, Michigan, Minnesota, Missouri, Nebraska, North Dakota, Ohio, South Dakota, and Wisconsin; the region contributes to a substantial amount of pollution through fertilizer and waste excess (Hatfield 2012).
The United States produces four major crops throughout the Midwest, corn, soy, hay, and wheat. Farming of these four crops cover over 250 million acres across our country, and contribute more than 100 billion dollars in revenue per year. The U.S. remains the world’s largest corn producer, with approximately 32% of total production (“Major Crops”). Still, according to the National Corn Growers Association, about 80% of America’s corn is used to feed livestock (“Corn & Livestock”). Beef cows and dairy cattle compose a $30 billion industry in the U.S. There are currently 33 million beef cows and approximately 12 million dairy cattle on feed across the country – that’s a cow for every seven people in America (“Beef Production”).
The agriculture industry is propagated by demand, and demand has skyrocketed in the past half-century. In the late 1950s the food supply in the U.S. accounted for approximately 3,000 calories per person per day; today, the food supply is equivalent to 3,800 calories per person per day. Additionally, the overweight population in America has risen from 46% in 1980, to 62% in the year 2000 (“Profiling Food Consumption”). We have witnessed the highest amount of meat consumption recorded in the U.S. in the past decade: 221.5 pounds per capita in 2006, although that number is slowly declining (“Average Annual…Meat”). Still, greater food production requires more energy, feed, land, and resources to sustain the demand, and much of our nation’s economy depends on it. One of the largest issues associated with increased food production is the increased use of synthetic fertilizers, and their effects on the environment.
3. Nutrient Runoff
Nutrient pollution refers to the leaching of synthetic fertilizers made of nitrogen and phosphorous into waterways. Pollution can occur from several sources, but agricultural runoff is the most common. Although nitrogen and phosphorous are vital to all life on earth, too much of a good thing appears to be harming ecosystems, bionetworks, and the environment.
The nitrogen cycle is a major component of Earth’s systems, where nitrogen exists in several different reservoirs, as well as multiple oxidation states. Nitrogen makes up DNA, RNA, and proteins (the building blocks of life), making the nutrient a dynamic and essential component of Earth. Nitrogen is abundant in the air – making up more than 75% of the atmosphere, yet its presence in the soil is rare. The largest reservoir of nitrogen is in the form N2, unusable for most living organisms. Nitrogen fixing bacteria play a major role in the nitrogen cycle, converting the unusable N2 to a chemically available form, NH4. This allows plants and animals to utilize the nutrient and to further its migration through the nitrogen cycle. Plants use NH4 to synthesize proteins, nucleic acids and hormones. The lack of available nitrogen in the soil, it is known as a limiting factor for plant growth (Blomberg 2011). In other words, nitrogen must be produced synthetically from sources not already present on Earth in order to produce yields that correspond to demand.
Therefore, to grow a large amount of a crop in a consolidated area, synthetic nitrogen has become very common since the Green Revolution. The Green Revolution refers to a series of research and development breakthroughs beginning in the 1940’s, using technology to produce extremely high-yield agricultural techniques (Fast 2014).
The process to generate synthetic nitrogen fertilizers requires energy and multiple non-renewable resources. Natural gas and steam are pumped into a large vessel where air is added to remove oxygen as the gas burns, which isolates ammonia. To add phosphorus, rock is treated with sulfuric acid and added to the fertilizer mixture. The fertilizer production process alone is a consumer of natural resources and energy, and can be expensive (Xue et al. 2014).
Unfortunately, a continued degradation of the once healthy soil used in the Midwest requires more nutrient application than ever before. Not only is farming causing soil deficiency, the NH3 functional to promote plant growth is needed in larger amounts than in comparison with the amount of biological nitrogen naturally used in plant growth. In 2010, 21 million tons of synthetic fertilizer were poured across American farmland (Nehring 2013)
More than half of that applied fertilizer isn’t stationary; instead the farmland will discharge much of it in the form of runoff. Runoff is a term that refers to a draining of water and substances as a result of rainfall; runoff in turn causes nutrient enrichment in the Mississippi River. A whopping 41% of the United States land drains into the Mississippi, an area approximately 3.2 million square kilometers. This is roughly equal to 600 million football fields (NOAA). Figure 1 identifies the agricultural sources in the continental United States that contribute to nutrients that flow into the Gulf of Mexico. In addition to cropland fertilizer runoff, poultry and livestock farms supply high nitrogen and phosphorous concentrations through their waste. Livestock farms in the U.S. reportedly produce 1.37 billions tons of waste annually, an approximation roughly 130 times greater than the waste produced by humans annually (“National Commission”).
4. Soil Loss
Due to the sheer quantity of nutrients used as fertilizers on farms, much of it does not end up in the crops. Instead, the nutrients leach out of the soil, into the groundwater, and create runoff. Nutrient-rich soils are carried into waterways through rainwater. This occurs even more so if the soil is eroded, which it often is in agricultural practices. In areas of natural vegetation, like the rainforest for example, soil is held in place through a variety of botanic roots. Alternately, if the land is ploughed the soil becomes dry and loose, and is easily swept away by forces of wind or water (“Soil Health Management”).
Iowa scientists in the environmental working group, Losing Ground, state that the average soil loss from natural processes is 5 tons per acre per year. Yet Iowa farmland was actually measured to lose an average of 100 tons per acre per year, meaning there is runoff from farms that is actually exceeding this number. A portion of the loss can be attributed to the lack of a buffer zone between cropland and waterways; without an area of trees or grass between crop fields and streams, farmers are able to cover more land with crops and produce higher yields. Fortunately research has proved that better soil management techniques can significantly reduce excess runoff, still many of these techniques remain poorly exploited (Zeland 2014)
5. Soils and Water Management
One form of soil management, no-till farming, refers to the practice of allowing crops to nourish the soil, instead of removing crops after harvesting through tillage. The practice has proven to reduce runoff and preserve soil, which can even serve as a system of carbon sequestration. Interestingly enough, this was the conventional method when agriculture began more than 8000 years ago. It wasn’t until the plow evolved that the breaking up of soil in this manner predominated. The invention of the tractor, and its ability to pull multiple plows at once swept farming environments, and soil erosion became a fundamental issue. Farming using tillage methods keeps the soil surface bare, leaving it vulnerable to erosion and water. Meanwhile, no-tillage allows the previous harvests residue to cover the soil surface – this conserves water and protects the soil from erosion (Huggins, Reganold 2008).
A study done on surface water quality in the Upper Mississippi River Basin proposed four scenarios to measure their varying effects on nutrient loading in the basin. The first was the expansion of continuous corn across the entire basin, the second was the adoption of no-till farming on all corn and soybean farms, the third was the substitution of continuous corn cropping with a five-year rotational crop cycle, and the fourth scenario was the implementation of a winter cover crop. The study concluded that, “continuous corn was the only scenario which resulted in increased N pollution, while no-till was the most environmentally effective and able to sustain production at almost the same levels” (Panagopoulos et al. 2014). Fortunately, no-till farming is on the rise. From 2004 to 2009 the percentage of wheat crops using no-till farming raised from 20% to almost 40%. Similarly, soybean crops rose from 35% to 45% from 2001 to 2006 (fig. 2).
Another issue facing preservation of healthy soils is the lack of crop diversity across U.S. farmland. Most of the farms that cover the Midwest are wheat, soy, or corn cropland. Monocultures can be detrimental to soil because they lack the range of carbohydrates that nourish soil. All plants utilize sunlight to convert carbon dioxide and water into carbohydrates, a process known as photosynthesis. The carbohydrates are released into the soil and feed soil microbes, which in turn provide nutrients and water. Still, one crop covering a large area can only support specific soil microbes with the carbohydrates they produce; therefore a lack of crop diversity leads to a deficiency in the soil. Deficient soil cannot grow crops as efficiently as healthy soil can. Agricultural biodiversity performs multiple ecosystem services, including recycling of nutrients, regulation of microclimate and local hydrological processes, suppression of undesirable organisms, and detoxification of noxious chemicals (Altieri 1999).
A recent research study conducted an eight-year field study using multiple crops to understand the benefit of ecosystem services and healthy soil to harvest. Their conclusion stated “results of our study indicate that more diverse cropping systems can use small amounts of synthetic agrichemical inputs as powerful tools with which to tune, rather than drive agroecosystem performance, while meeting or exceeding the performance of less diverse systems” (“Healthy Farm Practices”).
Another technique that is being researched in the reduction of nitrate leaching is the use of cover crops. This refers to the practice of planting specific crops in the farming off-season to increase soil fertility through the addition of nutrients from plant growth. The technique also provides ‘cover’ to hold the soil in place, protecting it from erosion and runoff before the next crop rotation is rooted. Until recently, this technique had not been widely research or adopted, so its effect on cropland remained yet to be quantified. A 2014 study done on Midwest cropland concluded that nitrate loadings to the Mississippi river could be reduced by 20% if cover crops were adopted across the board (Kladivko et al. 2014).
Apart from soil management, water management also plays a major role in impeding nutrient runoff. Drainage water management, or DWM, is a new practice that has been provided by the USDA’s Natural Resource Conservation Service (NRCS) that allows farmers to control water use and loss. The NRCS cites issues with farming and water use as the surplus of water in the spring and fall, and a deficit of water in the summer. DWM uses water control structures that are installed in the tile line, creating a zone of influence surround the structure (fig. 3). When properly managed, the system can be used to manage the timing and amount discharged from agricultural drainage systems. The system is able to minimize unnecessary drainage, or runoff, reducing the amount of nitrate that is leaving the farms (“Water Management”).
A study done in central Iowa reported the changes in yield and nitrate losses from the use of DWM. The study discusses their impressive results; “The field was in a two-year corn-soybean rotation with nitrogen (n) fertilizer applied before the corn crop only. During four years of monitoring the tile flow, there was a significant (p=0.05) 21% decrease in tile flow, 110 significant decrease in NO3 concentration, and a significant 29% reduction in NO3 load leaching from the DWM treatment compared to conventional drainage. No yield benefits from DWM were observed for the two year average for corn (2006 and 2008), but a significant yield increase of 8% was observed for the two year average for soybean (2007 and 2009)” (Jaynes 2012).
Fortunately, the United States Department of Agriculture has created a cost-share and rental program known as the Conservation Reserve Program (CRP). Here, farmers are encouraged to convert highly erodible cropland to vegetative cover in an effort to heal the environment and its soil. Science of the Total Environment released a publication that applied the Soil and Water Assessment tool to simulate a reduction in nitrogen loadings the Upper Mississippi River Basin to an enrollment of all Midwestern cropland into the CRP. They conceded that this action would bring the Gulf of Mexico dead zone below 5,000 square kilometers in less than two years (Whittaker et al. 2015).
6. Eutrophication and HABs
Between 1955 and 1970, the average discharge of nitrogen was 328,000 metric tons per year. The past decade’s annual average amounted to 1.57 million metric tons of nitrogen discharged into the Gulf of Mexico via the Mississippi River. Part of this number is released by the Atchafalaya River Basin, which also feeds into the Gulf of Mexico, but at smaller volumes. Figure 4 identifies sources of nitrogen input in the Midwest between 1950 and 2000. Naturally occurring atmospheric nitrate and ammonia levels are significantly lower than the anthropogenic sources shown. Natural atmospheric concentrations are trumped by animal waste, farmland, and above all fertilizer usage (Battaglin, Goolsby 2000). This nutrient enrichment is known as eutrophication, and can lead to a myriad of biological consequences.
Aside from the terrestrial plants we typically associate with photosynthesis, about half of the oxygen we breathe is produced by tiny photosynthetic organisms that live in the top layer of the ocean – phytoplankton. Phytoplankton are buoyant, existing and floating through the photic zone. The photic zone is known as the depth of water in the ocean that light is able to penetrate, and primary producers are able to utilize nutrients and sunlight to produce oxygen (Achary et al. 2014). In a balanced system, phytoplankton are vital, for they function as the bottom layer of the food chain. Other larger organisms feed off phytoplankton, like zooplankton, which are then eaten by larger fish and so on. When eutrophication dominates, a surplus of nutrients is made available for phytoplankton. When nutrient levels are high, in areas of upwelling for example, primary productivity prospers.
When productivity is high, the surrounding marine habitat will flourish. Fish that exist in higher levels of the trophic cycle will be drawn to the area and the initial marine response is a thriving ecosystem. A thriving marine habitat concentrates waste and inorganic material on the local seafloor, which is decomposed by bacteria. These marine decomposing bacteria break down organic matter to make nutrients available for other organisms. This process requires the consumption of dissolved oxygen by bacteria in order to perform their biological processes. Where there is more marine matter readily available for decomposition, waters will become oxygen deficient, or hypoxic (Quish et al. 2014). The faster nutrients are transported to the Gulf of Mexico, the quicker phytoplankton will grow.
If a body of water is continuously nutrient rich and oxygen deficient, the populations of the upper levels of the trophic system will begin to decline, and phytoplankton are no longer helping balance the oxygen in the ocean. Eutrophication, and an explosion in the cellular population will form harmful algal blooms, or HABs under the right conditions. Warmer climates promote the growth of algae, with an optimal temperature of about 25° Celsius. HABs favor the water being dispensed into the Gulf of Mexico because of its temperature in the warmer months. The Gulf of Mexico dead zone has been observed to expand greatly during the summer, a combination of warmer temperature and the surplus of nutrients due to spring crop fertilization. Additionally, HABs indulge in relatively calm and shallow waters (“What Causes Algal Blooms”).
HABs become toxic when the readiness of nutrients is not in the typical oceanic proportions, in accordance with the Redfield Ratios. The stoichiometric ratio refers to carbon, nitrogen and phosphorous on a proportional basis measured on a molar scale as C:N:P = 106:16:1. No matter the concentrations of these nutrients, the proportions are consistent throughout all the world’s oceans. If nutrients are out of this basic balance, as they often are in areas of runoff, HABs are no longer just a growth of algae but instead a geographic area of toxicity (Gilbert et al. 2014).
7. Consequences of HABs
HABs have significant environmental and economic consequences. Harmful algal blooms have become the main focus of many marine and environmental organizations, because of their multitude of effects on economy, human health, local habitat, marine life, and other ecosystem services. A publication in Global Change Biology cites their causes as, “fish kills, contaminate seafood with toxins, form unsightly scums, or detrimentally alter ecosystem function.” Unfortunately, many of these consequences are currently unquantifiable.
The consumption of shellfish contaminated with toxins poses threats to human health, and activities in polluted waters can cover swimmers in a layer of toxic scum. Contact of skin with harmful algae can cause rashes and irritations, and swimming areas that have been dominated by HABs usually prohibit swimming and other recreational aquatic activities. According to the National Oceanic and Atmospheric Administration, airborne HAB toxins can also cause breathing issues and initiate asthma attacks among those vulnerable individuals (“Why do Harmful Algal Blooms Occur”).
The most immediate consequence of algal blooms is its effect on the fishing industry. HABs have been known to directly cause fish kills, via the depletion of oxygen available to marine life as well as suffocation through the coating of gills with algae mucus. Very little marine life can survive in dead zones like the one seen in the Gulf of Mexico, and recovery of the ecosystem is only possible if the nutrient input is severely reduced (Moss 2010). A study published in Plos Biology states the effect on the fishing industry to be equivalent to $1.4 billion annually; “In the Gulf of Mexico, commercial and recreational fisheries currently generate US$2.8 billion annually. However, one half of the shellfish and many oyster beds have either been permanently closed or declared indefinitely off-limits by health officials as a result of N pollution” (Good, Beaty 2011).
Contamination of drinking water is also of major concern in dead zone areas. The high supply of nutrients and toxins in drinking water can cause stomach or liver illness, respiratory problems, and even neurological effects. Infants that consume contaminated water are more susceptible to their toxins and have found to have symptoms such as shortness of breath and blue tinted skin, a condition known as blue baby syndrome (“The Effects: Human Health”). The cost of cleaning up contaminated drinking water can be estimated in the billions. The EPA states, “Nitrate-removal systems in Minnesota caused supply costs to raise from 5-10 cents per 1000 gallons to over $4 per 1000 gallons” (“The Effects: Economy”).
The Gulf of Mexico is not the only casualty in the realm of water pollution; every U.S. coastal state has experienced a harmful algal bloom in the past decade, and the economic toll has been great (“Harmful Algal Blooms”). A comprehensive study was done in 2013 at the Environmental Law Institute to measure the total price tag commodity crops cost the U.S. They calculated, “According to a 2012 Woods Hole Oceanographic estimate, HABs cost the United States nearly $50 million annually; including $20 million in public health costs, $18 million in losses for commercial fisheries, $7 million in losses from the recreation and tourism industries, and $2 million in management and monitoring. In contrast, a 2006 National Center for Coastal Ocean Science study estimates that HABs cost the country $82 million per year, due in part to much larger estimates for fishery and public health impacts. Both the Woods Hole and Oceanographic Institute and the National Center for Coastal Ocean Service consider their estimates to be conservative. In fact a 1998 study found that HABs had resulted in $100 million in losses annually in the preceding 25 years.”
8. Environmental Policies
The rising level of nitrogen input and its association with dead zones to the Mississippi River Basin stimulated response from bordering states and their legislative bodies. The average running size of the Gulf of Mexico dead zone was 14,128 km2 in 2001, a geographic size in desperate need of attention. The issue surrounding nutrient input for a long while remained a question of the causes of declining marine life; today the issue facing us the uncertainty of non-point source pollution. Although overwhelming amounts of data have determined that nutrient pollution in the Gulf of Mexico is a direct result of agricultural and other anthropogenic activities, concrete governmental action wasn’t taken until well into the late 20th century.
In 1997 the Mississippi River Gulf of Mexico Watershed Nutrient Taskforce was established to help promote understanding of the causal relationship between nutrient enrichment and the deterioration of marine ecosystems in the Gulf of Mexico. The organization encompassed 12 states whose land drains into the Mississippi River Basin: Indiana, Illinois, Iowa, Louisiana, Kentucky, Minnesota, Mississippi, Missouri, Ohio, Wisconsin, Arkansas, and Tennessee. The task force released its first plan, the 2001 Action Plan, a national effort to reduce the occurrence of hypoxic conditions in the Gulf of Mexico.
The plan was submitted in conjunction with the Harmful Algal Bloom and Hypoxia Research and Control Act of 1998: the first government mandated program to research the hypoxic conditions in the Gulf of Mexico (“Hypoxia in the Northern Gulf”). The 2001 Action Plan identified two primary approaches to reduce hypoxia “1) reduce nitrogen loads from watersheds to streams and rivers in the Basin and 2) restore and enhance denitrification and nitrogen retention within the Basin and on the coastal plain of Louisiana.” The task force instituted regulations under the Clean Water Act to appropriate actions necessary to enhance overall water quality. The plan’s long-term goal was to reduce nitrogen discharge by 30% by 2005, in order to raise the dissolved oxygen level above the 2 mg/l threshold to support marine life. The task force later reassessed their action plan in 2008 and again in 2013 (“Action Plan”).
The 2013 Action Plan identifies another trigger of hypoxia in the Northern Gulf of Mexico: stratification of the water column. The reassessment states, “Nutrient-laden freshwater from the [Mississippi/Atchafalaya River Basin] is warmer and less dense than the deep-ocean water, and contributes to the formation of an upper, less saline, surface layer.” Water column stratification coupled with rapid algae growth has resulted in massive hypoxia in the region.
The Clean Water Act was transcribed in 1972, the first and primary federal law governing the pollution of waterways in the United States. The CWA gave the Environmental Protection Agency the authority to dictate pollution control programs like wastewater discharge from industry in its primal stages. Over the years, the CWA has blanketed much more operations, such as the Great Lakes Water Quality Agreement, the National Pollution Discharge Elimination System, National Estuary Program, National Coastal Water Program and many others. Still, agriculture remains one of the last unregulated causes of non-point source pollution. There has been a strong urgency from the EPA for agricultural farmers in the U.S. to adopt water control and soil preservation techniques, but there is very little legal regulation demanding it (Schnoor 2014). Many environmentalist groups are demanding more intense regulations on water control and quality, but the regulations remain delicate. In fact, the EPA’s webpage linking to regulations on non-point source agricultural pollution regulations provides an error page.
Additionally, 56 new agricultural exemptions of the Clean Water Act were made in 2014, and their legislation doesn’t require approval by the Environmental Protection Agency (McCarthy 2014). These exemptions may be attributed to the strong economical ties the U.S. government has with the agricultural industry. The United States Department of Agriculture, or USDA, distributes an estimated $20 billion in cash subsidies to farmers each year. Although much can be done with this large sum of money, more than 90% of it is allocated between the five main cash crops in the U.S., wheat, corn, soy, cotton, and rice. Remembering that 80% of the U.S. corn production is used to feed livestock, a $30 billion dollar industry, it’s not hard to see the reasoning behind the government supports of the agricultural industry.
9. Conclusion
Nitrogen and phosphorous can be considered the framework for a biological system that leads to nutrient enrichment. The increasing demand for higher agricultural yields has pushed industry over the environmental edge. While more land is cleared every day for agricultural usage, adding to the current 250 million acres used for cropland, the Mississippi River Basin is continuously at risk from the practices used on this cropland. Fertilizer usage has skyrocketed in the past few decades, and its contribution to water contamination through runoff is significant. The continuous inflow of nutrients into the Mississippi River Basin, and their eventual movement into the Gulf of Mexico has delivered a massive area of hypoxia, worrisome to the economy, environment, and human health. Harmful algal blooms and their multitude of environmental consequences have led to some low key legislation but nothing severe, nor anything that lays much responsibility on the polluters themselves. Fortunately, techniques have been developed to reduce the nutrient loading in the river basin. No-till farming, cover crops, soil diversity and drainage water management all provide promising effects on the current nutrient pollution situation. Although adoption remains low, it is clear that these techniques provide the future of sustainable agriculture. In hopes that the Gulf of Mexico’s ecosystem is on the road to recovery, the agricultural industry must be required to use better farming practices to reduce nutrient loading and storm water runoff on their cropland. The Mississippi River Basin/ Gulf of Mexico Watershed Taskforce has taken action and made significant gains in researching causes and effects of the dead zone in the Gulf of Mexico. Still, regulations remain largely unenforced under government legislation such as the Clean Water Act and actions taken by the Environmental Protection Agency. The future of marine ecosystems, in the U.S. and elsewhere, remain essentially in the hands of the polluters, but it is also to be remembered that the polluters are funded by their consumers, us. The vast cropland of the Midwest cannot be easily targeted in the reduction of nutrient pollution unless legal regulations mandate it, or the polluters can take responsibility and adopt water and soil management techniques on their own. All parties must work collectively to manage the release of nutrients into the Mississippi River Basin, and allow the once thriving ecosystem just south of Louisiana to once again flourish.
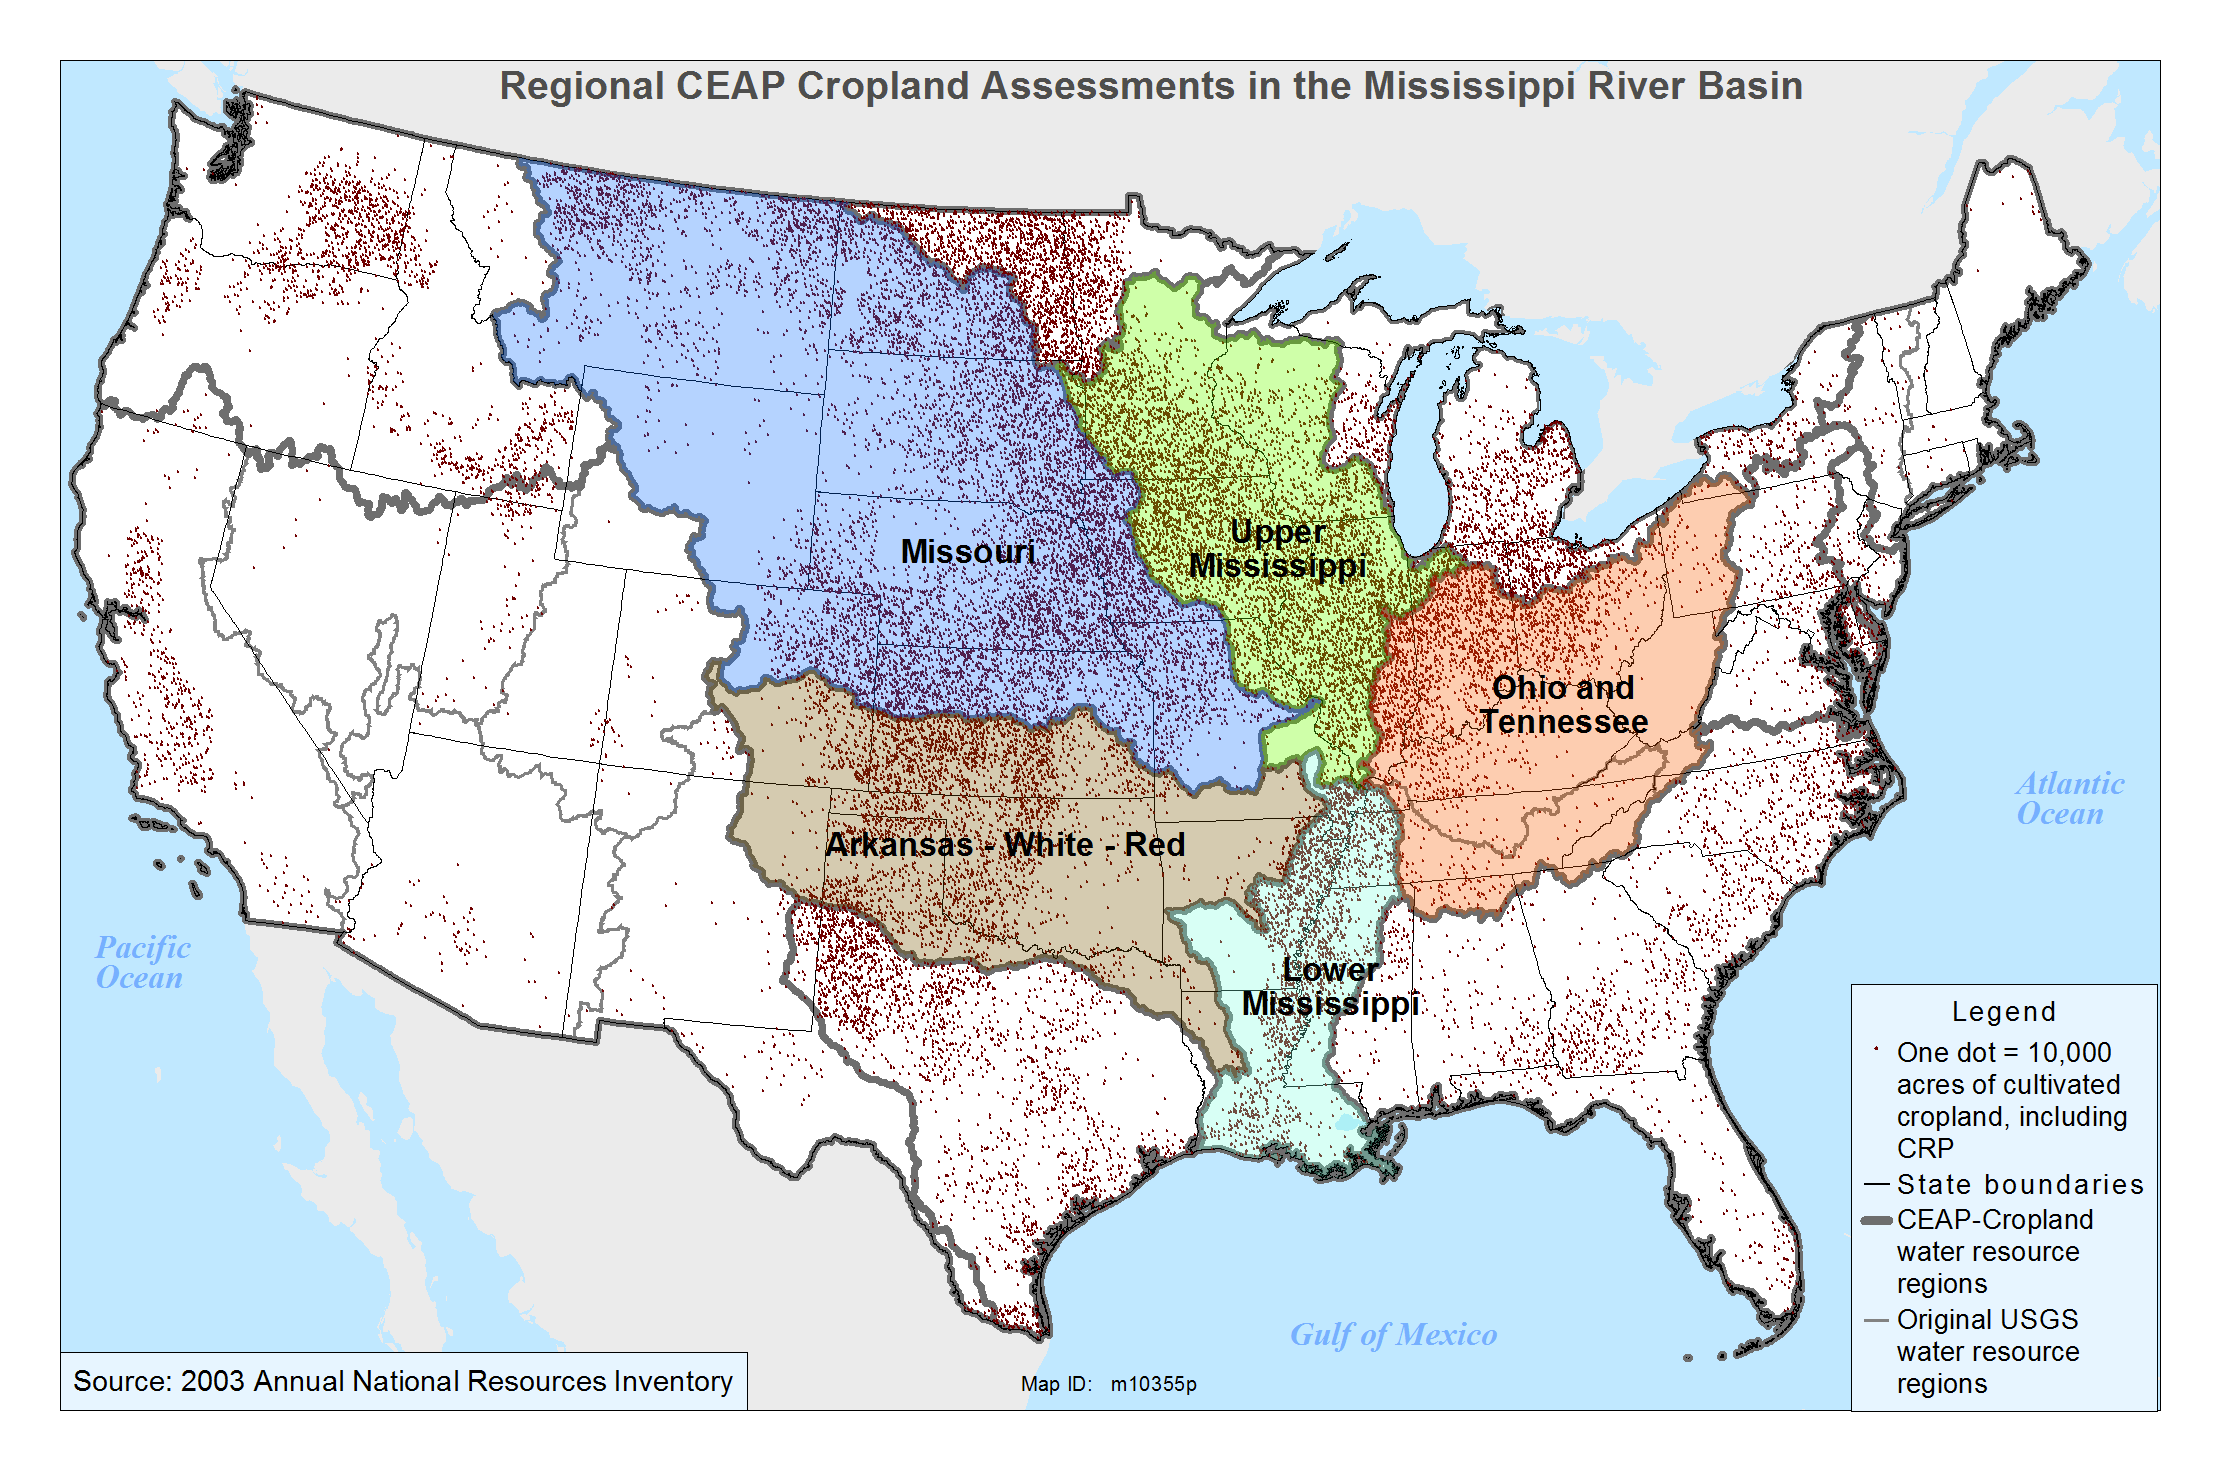
Fig. 1. Depicts all cultivated cropland in the continental U.S (Maxwell 2014).
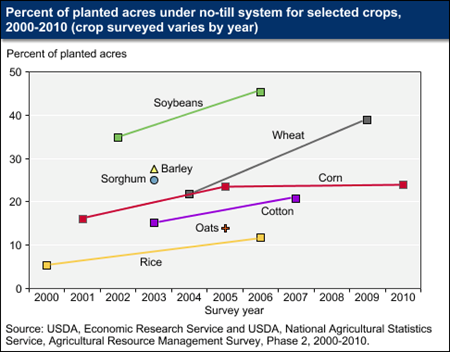
Fig. 2. ERS and USDA statistics of no-tillage acreage in the U.S. of several crops (Ebel 2013)
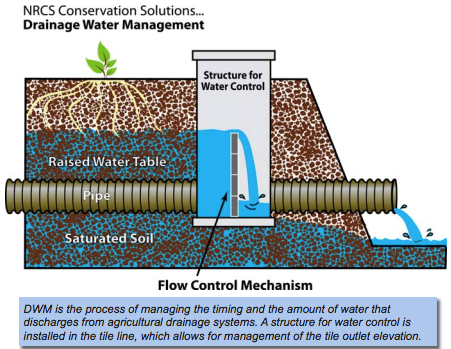
Fig. 3. The NRCS diagram of the water control structure used in (“Water Management”)
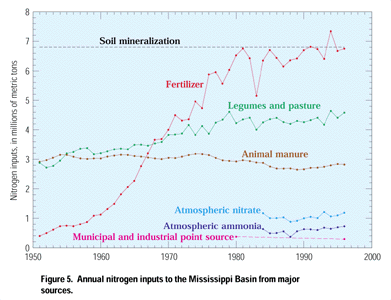
Fig. 4 Nitrogen input sources in the Midwest between 1950 and 2000 (Battaglin, Goolsby 2000)
Works Cited
Achary, M., et al. “Nutrient Dynamics and Seasonal Variation of Phytoplankton Assemblages in the Coastal Waters of Southwest Bay of Bengal.” Environmental Monitoring & Assessment 186.9 (2014): 5681-95. Web.
“Action Plan for Reducing, Mitigating, and Controlling Hypoxia in the Northern Gulf of Mexico.”
River/Gulf of Mexico Watershed Nutrient Taskforce (2001): 1-31. Web.
Altieri, Miguel A. “The Ecological Role of Biodiversity in Agro-ecosystems.” Agriculture, Ecosystems & Environment 74.1?3 (1999): 19-31. Web.
Average Annual Per Capita Consumption of Meat. National Cattlemen’s Beef Association. Web. 2014.
“Beef Production.” United States: Environmental Protection Agency: Ag 101. 2012.Web. 2014 <http://www.epa.gov/agriculture/ag101/printbeef.html>.
Blomberg, Lindsey. “Dead in the Gulf.” E THIS WEEK (2011): 3-. Web.
Breggin, Linda K., Bruce Myers, and Meredith Wilensky. “It’s Time to Put a Price Tag on the Environmental Impacts of Commodity Crop Agriculture.” Environmental Law Reporter: News & Analysis 43.2 (2013): 10130-7. Web.
“Corn & Livestock.” National Corn Growers Association: 1-44. Web. <http://www.ncga.com/upload/files/documents/pdf/ncga_livestock_booklet-web.pdf>.
Davidson, Keith, et al. “Anthropogenic Nutrients and Harmful Algae in Coastal Waters.” Journal of Environmental Management 146 (2014): 206-16. Web.
Ebel, Robert. “USDA ERS – Chart: Recent Evidence Suggests that Farmers Continue To Adopt No-Till on More Cropland.” United States Department of Agriculture: Economic Research Service.2013.Web. 2014 <http://www.ers.usda.gov/data-products/chart-gallery/detail.aspx?chartId=37841&ref=collection&embed=true#.Unlad3BeaSo>.
“The Effects: Economy.” United States Environmental Protection Agency. 2014.Web. <http://www2.epa.gov/nutrientpollution/effects-economy>.
“The Effects: Human Health.” United States Environmental Protection Agency. 2014.Web. <http://www2.epa.gov/nutrientpollution/effects-human-health>.
Fast, Dana. “The High Costs we Pay for Cheap Food.” Mother Earth News.265 (2014): 10-. Web.
Gilbert, Patricia M., et al. “Vulnerability of Coastal Ecosystems to Changes in Harmful Algal Bloom Distribution in Response to Climate Change: Projections Based on Model Analysis.” Global Change Biology 20.12 (2014): 3845-58. Web.
Good, Allen G., and Perrin H. Beatty. “Fertilizing Nature: A Tragedy of Excess in the Commons.” PLoS Biology 9.8 (2011): 1-9. Web.
Goolsby, Donald A., Battaglin, William A. “Nitrogen in the Mississippi Basin: Estimating Sources and Predicting Flux to the Gulf of Mexico.” United States Geological Survey. December 2000.Web. 2014 <http://ks.water.usgs.gov/pubs/fact-sheets/fs.135-00.html>.
“Harmful Algal Blooms.” NOAA: National Centers for Coastal Ocean Science. 2004.Web. 2014 <http://coastalscience.noaa.gov/research/habs/>.
Hatfield, Jerry. “U.S. National Climate Assessment: Midwest Technical Input Report: Agriculture Sector White Paper.” Great Lakes Integrated Sciences and Assessments (2012)Web. 11/20/14.
“Healthy Farm Practices: Crop Diversity and Rotation.” Union of Concerned Scientists. Web. 2014 <http://www.ucsusa.org/food_and_agriculture/solutions/advance-sustainable-agriculture/crop-diversity-and-rotation.html#.VIi8jmTF_NW>.
Huggins, David R., Reganold, John P. “No-Till: The Quiet Revolution.” Scientific American 2008Web. November 25, 2014 <http://research.wsu.edu/resources/files/no-till.pdf>.
“An Integrated Assessment: Hypoxia in the Northern Gulf of Mexico.” National Science and Technology Council (2000): 1-55. Web.
Jaynes, D. B. “Changes in Yield and Nitrate Losses from using Drainage Water Management in Central Iowa, United States.” Journal of Soil & Water Conservation 67.6 (2012): 485-94. Web.
Kladivko, E. J., et al. “Cover Crops in the Upper Midwestern United States: Potential Adoption and Reduction of Nitrate Leaching in the Mississippi River Basin.” Journal of Soil & Water Conservation 69.4 (2014): 279-91. Web.
“Major Crops Grown in the United States.” United States Environmental Protection Agency: Ag 101. 2013.Web. 2014 <http://www.epa.gov/oecaagct/ag101/cropmajor.html>.
Manuel, John. “Nutrient Pollution.” Environmental Health Perspectives 122.11 (2014): A309. Web.
Maxwell, Sarah. “Report: Conservation Work Minimizes Sediment, Nutrient Runoff.” USDA: National Resources Conservation Service Arkansas. 2013.Web. 2014 <http://www.nrcs.usda.gov/wps/portal/nrcs/detail/ar/home/?cid=stelprdb1177032>.
Mississippi River Water Quality and the Clean Water Act: Progress, Challenges, and Opportunities. The National Academies. Web.
“National Commission on Industrial Farm Animal Production | Environment Issues.” 2006.Web. 11/20/14 <http://www.ncifap.org/issues/environment/>.
Nehring, Richard. “Chemical Inputs: Fertilizer Use & Markets.” United States Department of Agriculture: Economic Research Service. 2013.Web. 2014 <http://www.ers.usda.gov/topics/farm-practices-management/chemical-inputs/fertilizer-use-markets.aspx#.UdxC0haBCI9>.
“New Exemptions Won’t Require Approval by EPA, Corps, McCarthy Says.” BNA’s Environmental Compliance Bulletin 21.15 (2014): 235-. Web.
NSW Government. “What Causes Algal Blooms.” Department of Primary Industries: Office of Water. Web. <http://www.water.nsw.gov.au/Water-Management/Water-quality/Algal-information/What-causes-algal-blooms/What-causes-algal-blooms/default.aspx>.
Panagopoulos, Y., et al. “Surface Water Quality and Cropping Systems Sustainability Under a Changing Climate in the Upper Mississippi River Basin.” Journal of Soil & Water Conservation 69.6 (2014): 483-94. Web.
“Profiling Food Consumption in America.” Agriculture Fact Book Chapter 2: 14-21. Web.
Reassessment 2013: Assessing Progress made since 2008. Hypoxia Task Force, 2013. Web.
Scheer, Roddy, and Doug Moss. “Ocean Dead Zones.” E THIS WEEK (2011): 5-. Web.
Schnoor, Jerald L. “Agriculture: The Last Unregulated Source.” Environmental Science & Technology 48.9 (2014): 4635-6. Web.
Shen, Qiushi, et al. “Beyond Hypoxia: Occurrence and Characteristics of Black Blooms Due to the Decomposition of the Submerged Plant Potamogeton Crispus in a Shallow Lake.” Journal of Environmental Sciences (Elsevier) 26.2 (2014): 281-8. Web.
“Soil Health Management.” National Resources Conservation Service: Soils. a. Web. 2014 <http://www.nrcs.usda.gov/wps/portal/nrcs/main/soils/health/mgnt/>.
“Soil Health Management.” USDA: National Resources Conservation Service: Soils. b. Web. 2014 <http://www.nrcs.usda.gov/wps/portal/nrcs/main/soils/health/mgnt/>.
“Task Force History and Reassessment.” Mississippi River Gulf of Mexico Watershed Nutrient Task Force. Web. 2014 <http://water.epa.gov/type/watersheds/named/msbasin/history.cfm>.
“Water Management.” USDA: National Resources Conservation Service. Web. 2014 <http://www.nrcs.usda.gov/wps/portal/nrcs/main/national/water/manage/>.
Whittaker, Gerald, et al. “Cost of Areal Reduction of Gulf Hypoxia through Agricultural Practice.” Science of the Total Environment 505 (2015): 149-53. Web.
“Why Do Harmful Algal Blooms Occur?” National Oceanic and Atmospheric Administration: National Ocean Service. Web. 2014 <http://oceanservice.noaa.gov/facts/why_habs.html>.
Xue, Xiaobo, YuLei Pang, and Amy E. Landis. “Evaluating Agricultural Management Practices to Improve the Environmental Footprint of Corn-Derived Ethanol.” Renewable Energy: An International Journal 66 (2014): 454-60. Web.
Zelman, Joanna. “Soil Erosion Far Worse Than Reported In American Farmlands, According To New EWG Report.” HuffPost Green. 2011.Web. 2014 <http://www.huffingtonpost.com/2011/04/12/soil-erosion-ewg-losing-ground-report_n_848096.html>.
Featured Image Copyright: / 123RF Stock Photo